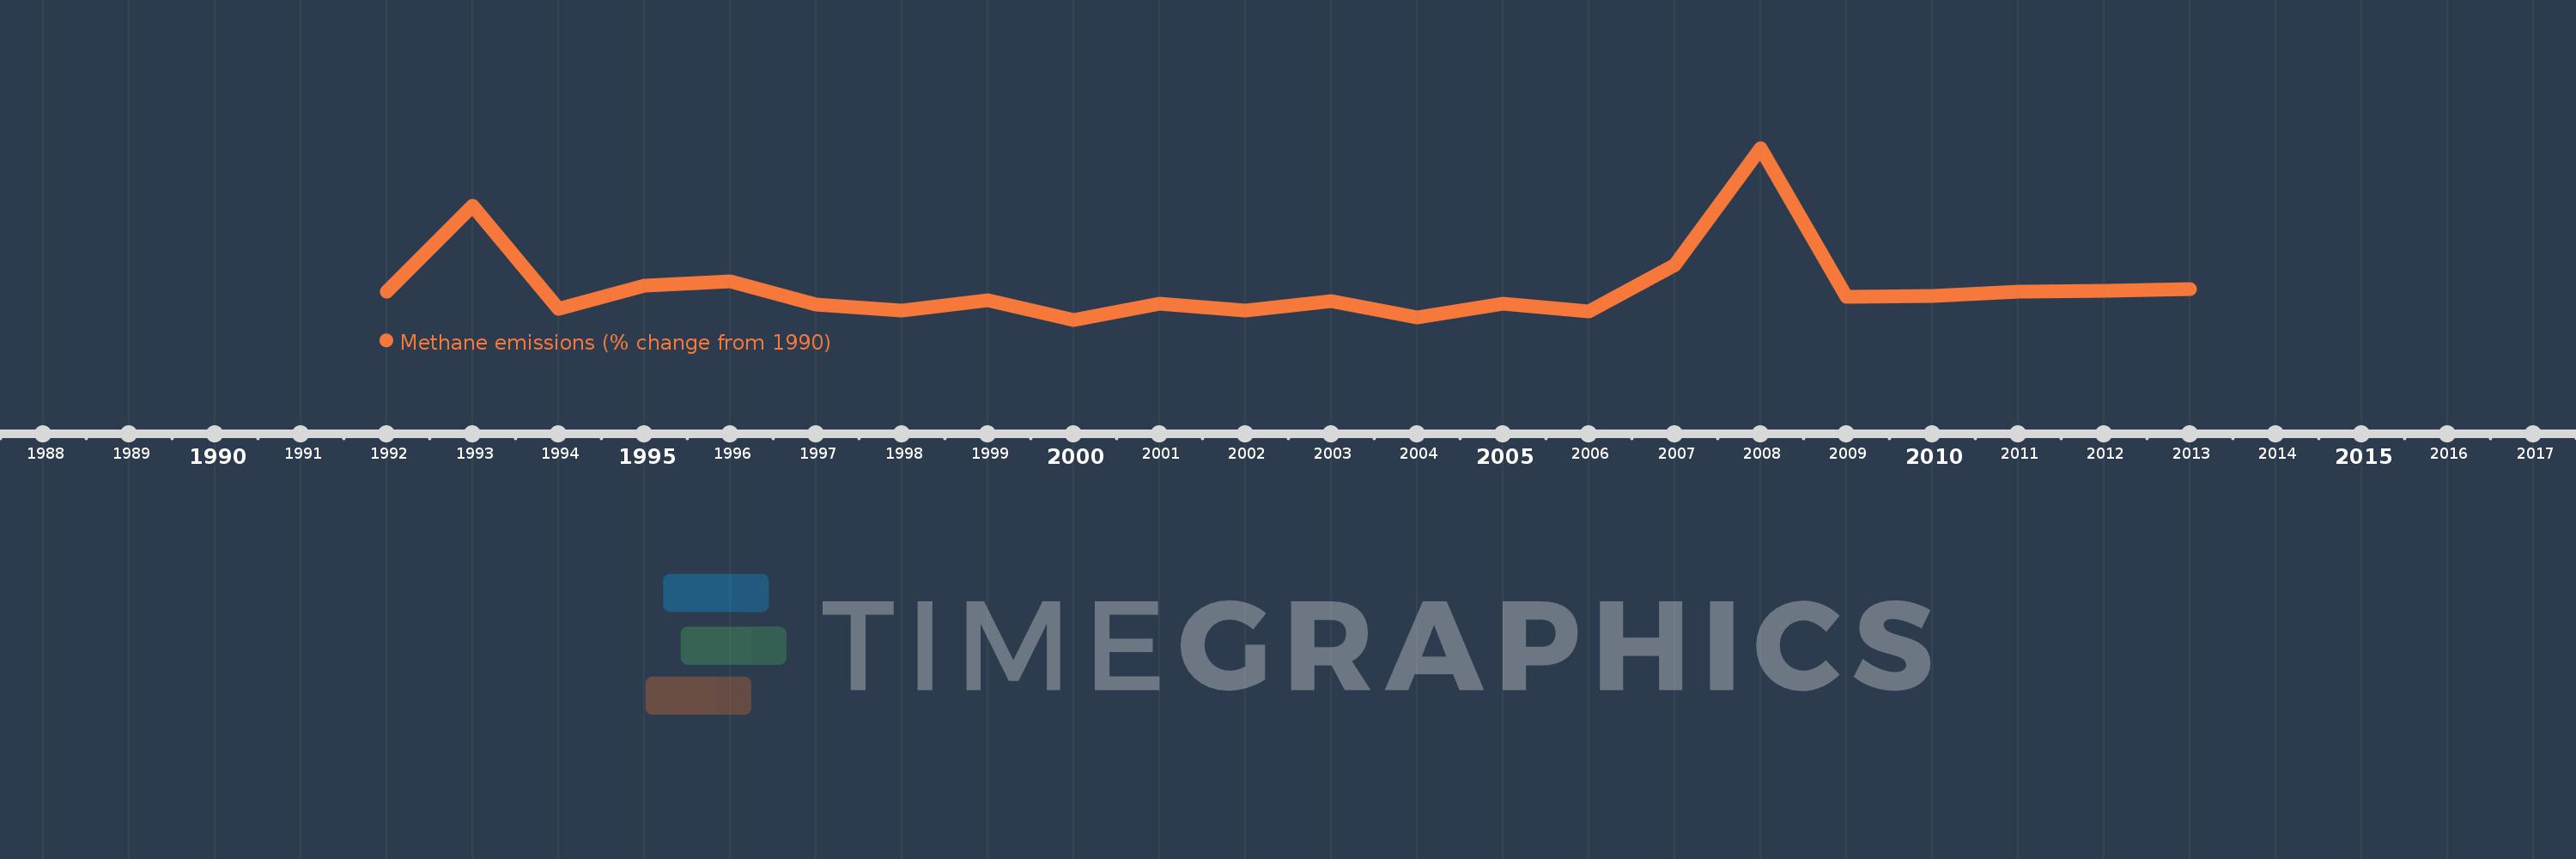
This timeline shows a graph from 1992 to 2013 of Congo, Dem. Rep.. No data until 1991. Number of actual observations by date: 22.
Source name:
World Development Indicators
Source organization:
World Bank staff estimates from original source: European Commission, Joint Research Centre (JRC)/Netherlands Environmental Assessment Agency (PBL). Emission Database for Global Atmospheric Research (EDGAR): http://edgar.jrc.ec.europa.eu/.
Categories, topics:
Climate Change, Environment
Last updated:
apr 23, 2017
Indicators value changes by year
Meaning:
-22.118
Minimum:
-48.254
jan 1, 2000
Maximum:
92.881
jan 1, 2008
At the date of observation
Value
Absolute change
Change from the previous value
jan 1, 1992
-25.292
-25.292
0.0%
jan 1, 1993
45.23
+70.522
-278.83%
jan 1, 1994
-39.575
-84.805
-187.5%
jan 1, 1995
-20.393
+19.183
-48.47%
jan 1, 1996
-17.014
+3.378
-16.57%
jan 1, 1997
-35.671
-18.656
109.65%
jan 1, 1998
-40.701
-5.03
14.1%
jan 1, 1999
-32.267
+8.433
-20.72%
jan 1, 2000
-48.254
-15.986
49.54%
jan 1, 2001
-35.229
+13.024
-26.99%
jan 1, 2002
-40.641
-5.411
15.36%
jan 1, 2003
-33.006
+7.635
-18.79%
jan 1, 2004
-46.209
-13.203
40.0%
jan 1, 2005
-35.251
+10.959
-23.72%
jan 1, 2006
-41.341
-6.091
17.28%
jan 1, 2007
-3.019
+38.322
-92.7%
jan 1, 2008
92.881
+95.9
-3.18K%
jan 1, 2009
-29.382
-122.262
-131.63%
jan 1, 2010
-29.031
+0.351
-1.19%
jan 1, 2011
-24.894
+4.137
-14.25%
jan 1, 2012
-24.143
+0.751
-3.02%
jan 1, 2013
-23.392
+0.751
-3.11%
Ranking of countries by current statistics by years