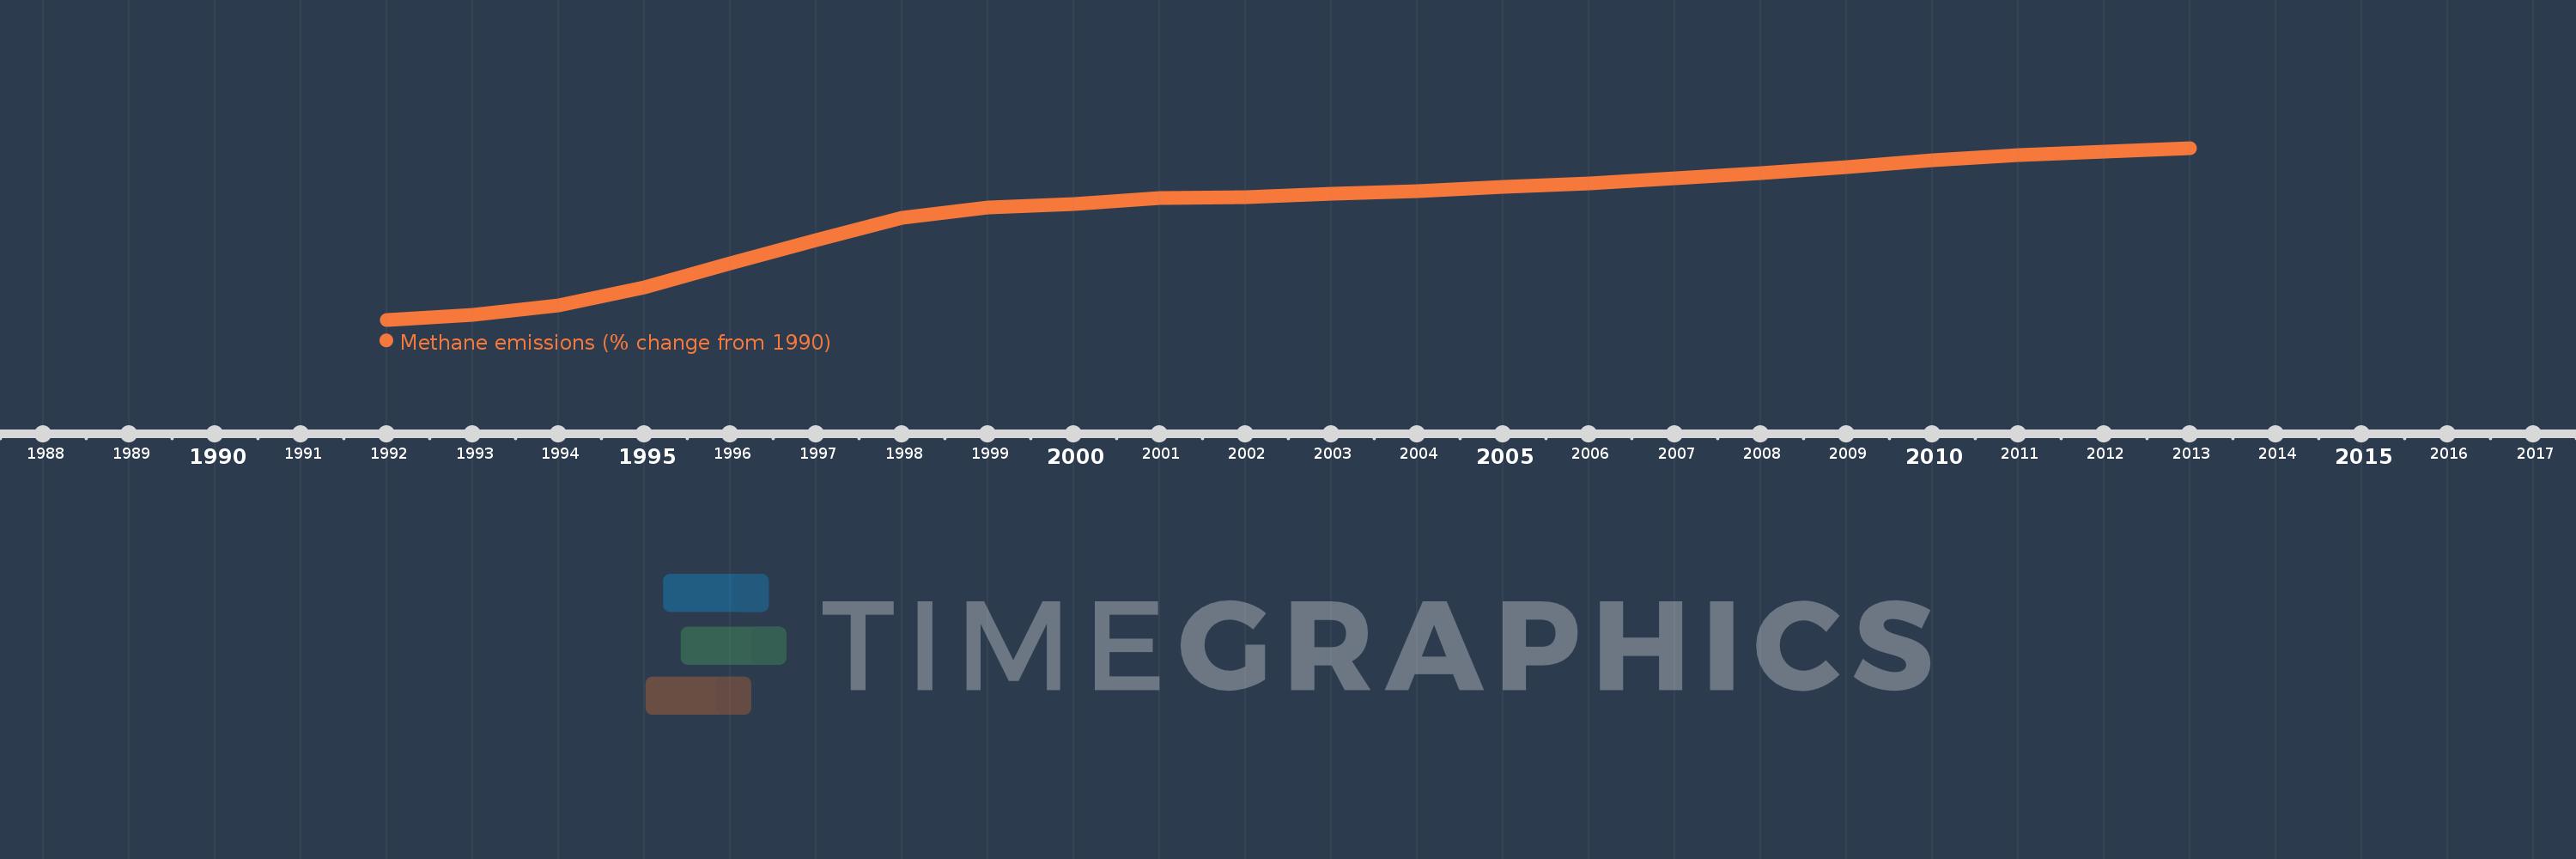
This timeline shows a graph from 1992 to 2013 of Hong Kong SAR, China. No data until 1991. Number of actual observations by date: 22.
Source name:
World Development Indicators
Source organization:
World Bank staff estimates from original source: European Commission, Joint Research Centre (JRC)/Netherlands Environmental Assessment Agency (PBL). Emission Database for Global Atmospheric Research (EDGAR): http://edgar.jrc.ec.europa.eu/.
Categories, topics:
Climate Change, Environment
Last updated:
apr 23, 2017
Indicators value changes by year
Meaning:
68.163
Minimum:
4.019
jan 1, 1992
Maximum:
105.437
jan 1, 2013
At the date of observation
Value
Absolute change
Change from the previous value
jan 1, 1992
4.019
+4.019
0.0%
jan 1, 1993
7.037
+3.018
75.07%
jan 1, 1994
12.269
+5.232
74.34%
jan 1, 1995
23.048
+10.78
87.86%
jan 1, 1996
37.185
+14.137
61.34%
jan 1, 1997
50.855
+13.669
36.76%
jan 1, 1998
64.319
+13.464
26.48%
jan 1, 1999
70.536
+6.217
9.67%
jan 1, 2000
72.287
+1.751
2.48%
jan 1, 2001
75.877
+3.59
4.97%
jan 1, 2002
76.587
+0.71
0.94%
jan 1, 2003
78.222
+1.635
2.13%
jan 1, 2004
80.055
+1.833
2.34%
jan 1, 2005
82.222
+2.167
2.71%
jan 1, 2006
84.398
+2.176
2.65%
jan 1, 2007
87.424
+3.026
3.59%
jan 1, 2008
90.684
+3.26
3.73%
jan 1, 2009
94.302
+3.619
3.99%
jan 1, 2010
97.988
+3.686
3.91%
jan 1, 2011
101.409
+3.421
3.49%
jan 1, 2012
103.423
+2.014
1.99%
jan 1, 2013
105.437
+2.014
1.95%
Ranking of countries by current statistics by years