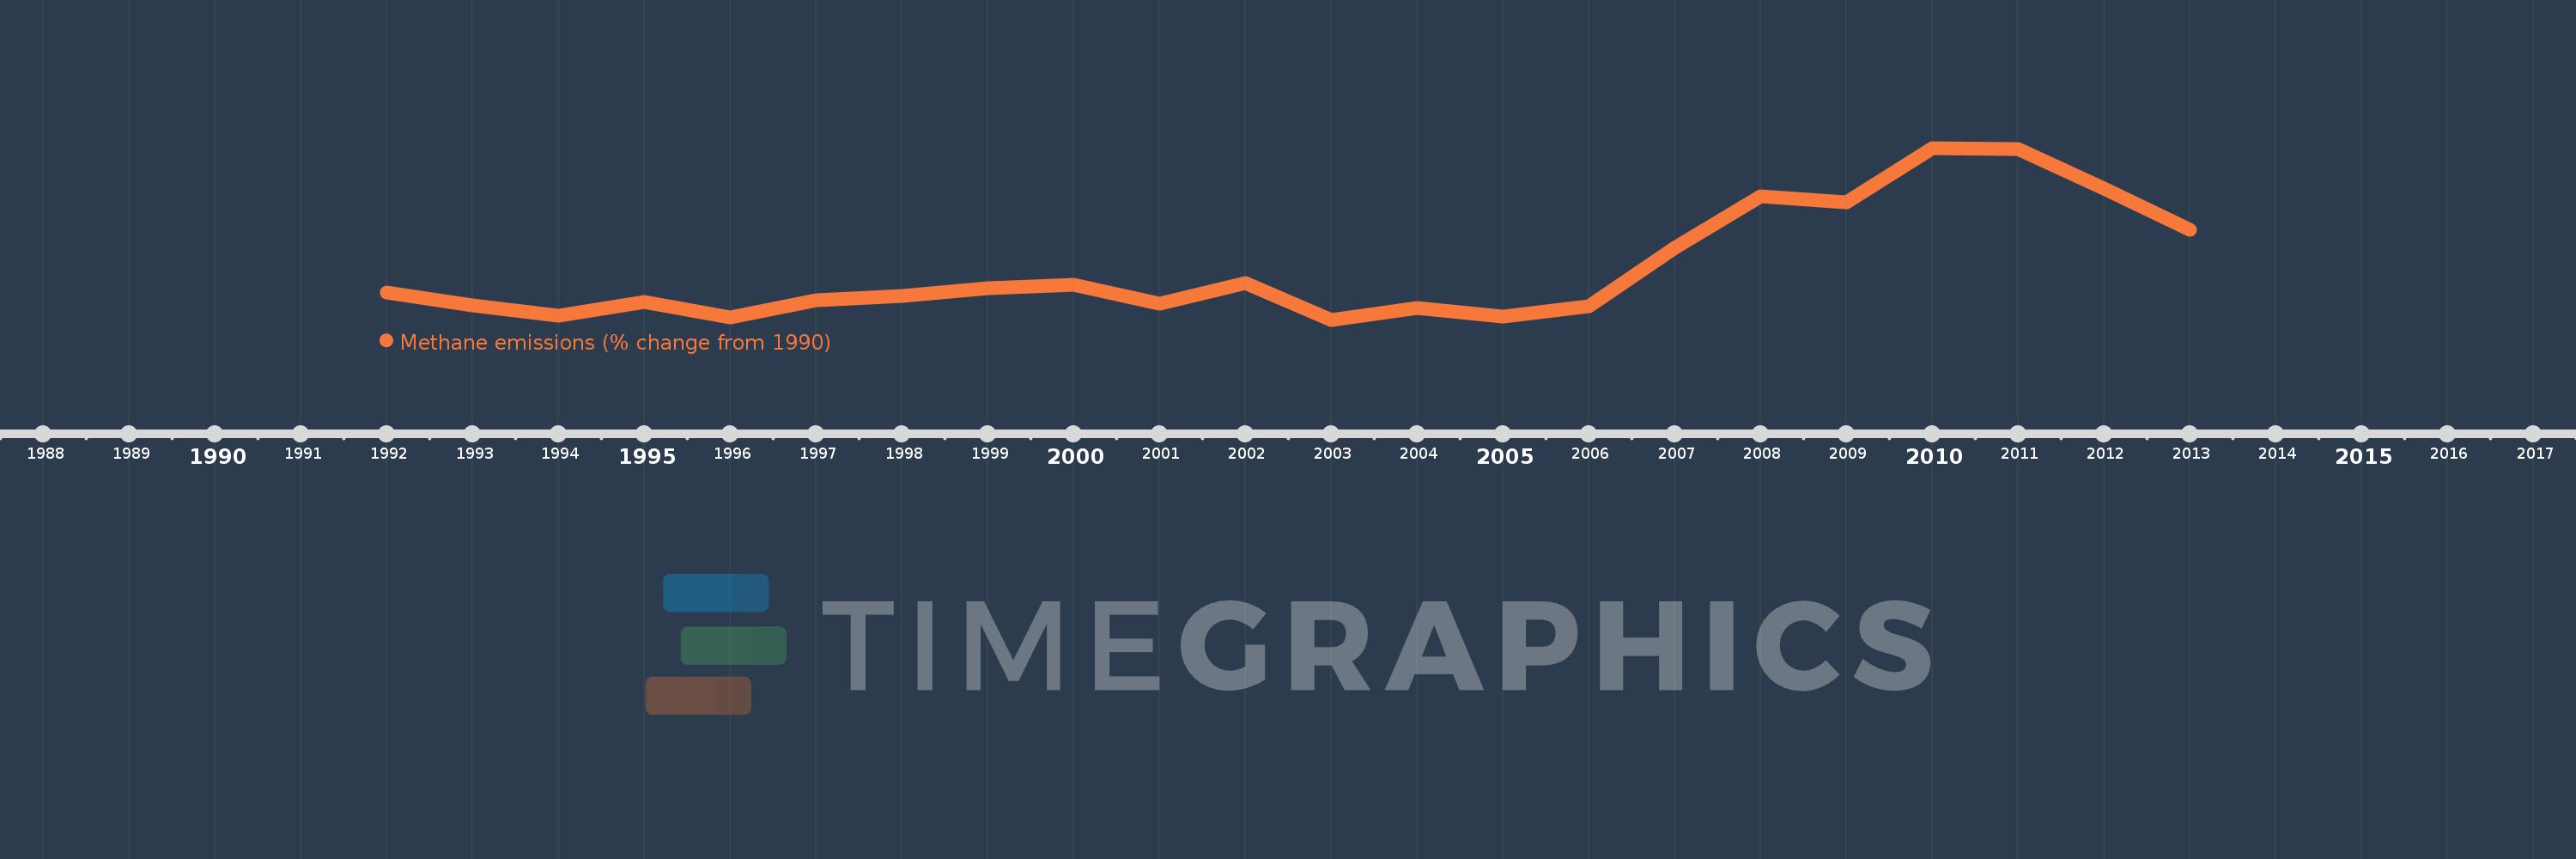
This timeline shows a graph from 1992 to 2013 of Iceland. No data until 1991. Number of actual observations by date: 22.
Source name:
World Development Indicators
Source organization:
World Bank staff estimates from original source: European Commission, Joint Research Centre (JRC)/Netherlands Environmental Assessment Agency (PBL). Emission Database for Global Atmospheric Research (EDGAR): http://edgar.jrc.ec.europa.eu/.
Categories, topics:
Climate Change, Environment
Last updated:
apr 23, 2017
Indicators value changes by year
Meaning:
1.623
Minimum:
-2.921
jan 1, 2003
Maximum:
12.218
jan 1, 2010
At the date of observation
Value
Absolute change
Change from the previous value
jan 1, 1992
-0.486
-0.486
0.0%
jan 1, 1993
-1.677
-1.191
244.91%
jan 1, 1994
-2.537
-0.861
51.34%
jan 1, 1995
-1.334
+1.204
-47.44%
jan 1, 1996
-2.711
-1.377
103.27%
jan 1, 1997
-1.197
+1.514
-55.84%
jan 1, 1998
-0.857
+0.34
-28.4%
jan 1, 1999
-0.128
+0.729
-85.01%
jan 1, 2000
0.196
+0.324
-252.39%
jan 1, 2001
-1.513
-1.709
-872.94%
jan 1, 2002
0.291
+1.804
-119.22%
jan 1, 2003
-2.921
-3.212
-1.1K%
jan 1, 2004
-1.861
+1.061
-36.31%
jan 1, 2005
-2.622
-0.761
40.92%
jan 1, 2006
-1.721
+0.901
-34.36%
jan 1, 2007
3.392
+5.113
-297.09%
jan 1, 2008
7.978
+4.585
135.17%
jan 1, 2009
7.444
-0.533
-6.68%
jan 1, 2010
12.218
+4.773
64.12%
jan 1, 2011
12.143
-0.074
-0.61%
jan 1, 2012
8.607
-3.536
-29.12%
jan 1, 2013
4.996
-3.611
-41.95%
Ranking of countries by current statistics by years