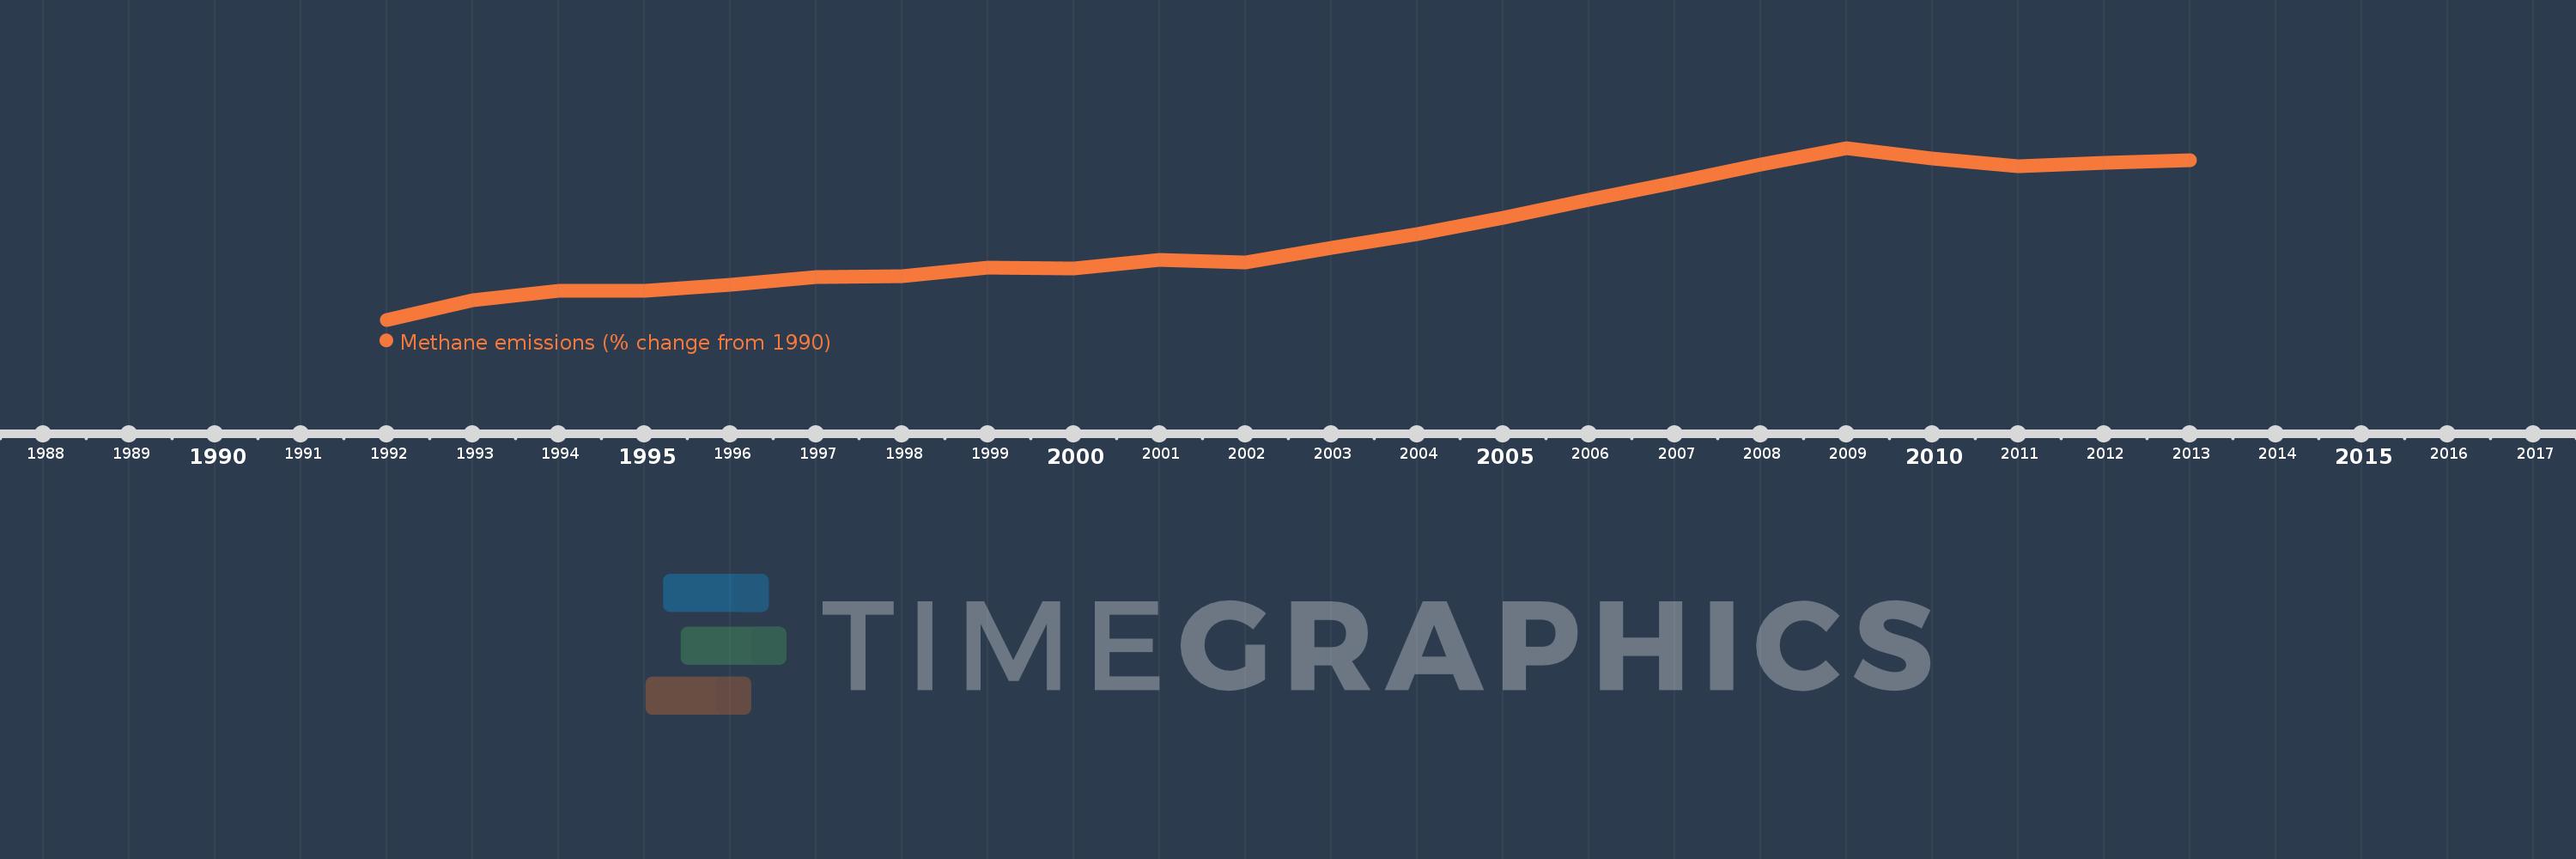
This timeline shows a graph from 1992 to 2013 of Jordan. No data until 1991. Number of actual observations by date: 22.
Source name:
World Development Indicators
Source organization:
World Bank staff estimates from original source: European Commission, Joint Research Centre (JRC)/Netherlands Environmental Assessment Agency (PBL). Emission Database for Global Atmospheric Research (EDGAR): http://edgar.jrc.ec.europa.eu/.
Categories, topics:
Climate Change, Environment
Last updated:
apr 23, 2017
Indicators value changes by year
Meaning:
83.441
Minimum:
12.137
jan 1, 1992
Maximum:
154.445
jan 1, 2009
At the date of observation
Value
Absolute change
Change from the previous value
jan 1, 1992
12.137
+12.137
0.0%
jan 1, 1993
28.616
+16.479
135.78%
jan 1, 1994
36.395
+7.78
27.19%
jan 1, 1995
36.089
-0.306
-0.84%
jan 1, 1996
41.414
+5.325
14.75%
jan 1, 1997
47.794
+6.38
15.41%
jan 1, 1998
48.166
+0.372
0.78%
jan 1, 1999
55.385
+7.219
14.99%
jan 1, 2000
54.669
-0.716
-1.29%
jan 1, 2001
61.595
+6.926
12.67%
jan 1, 2002
59.26
-2.335
-3.79%
jan 1, 2003
71.38
+12.119
20.45%
jan 1, 2004
83.426
+12.047
16.88%
jan 1, 2005
96.424
+12.997
15.58%
jan 1, 2006
111.539
+15.115
15.68%
jan 1, 2007
125.652
+14.114
12.65%
jan 1, 2008
140.388
+14.735
11.73%
jan 1, 2009
154.445
+14.057
10.01%
jan 1, 2010
145.476
-8.969
-5.81%
jan 1, 2011
139.423
-6.052
-4.16%
jan 1, 2012
141.818
+2.394
1.72%
jan 1, 2013
144.212
+2.394
1.69%
Ranking of countries by current statistics by years