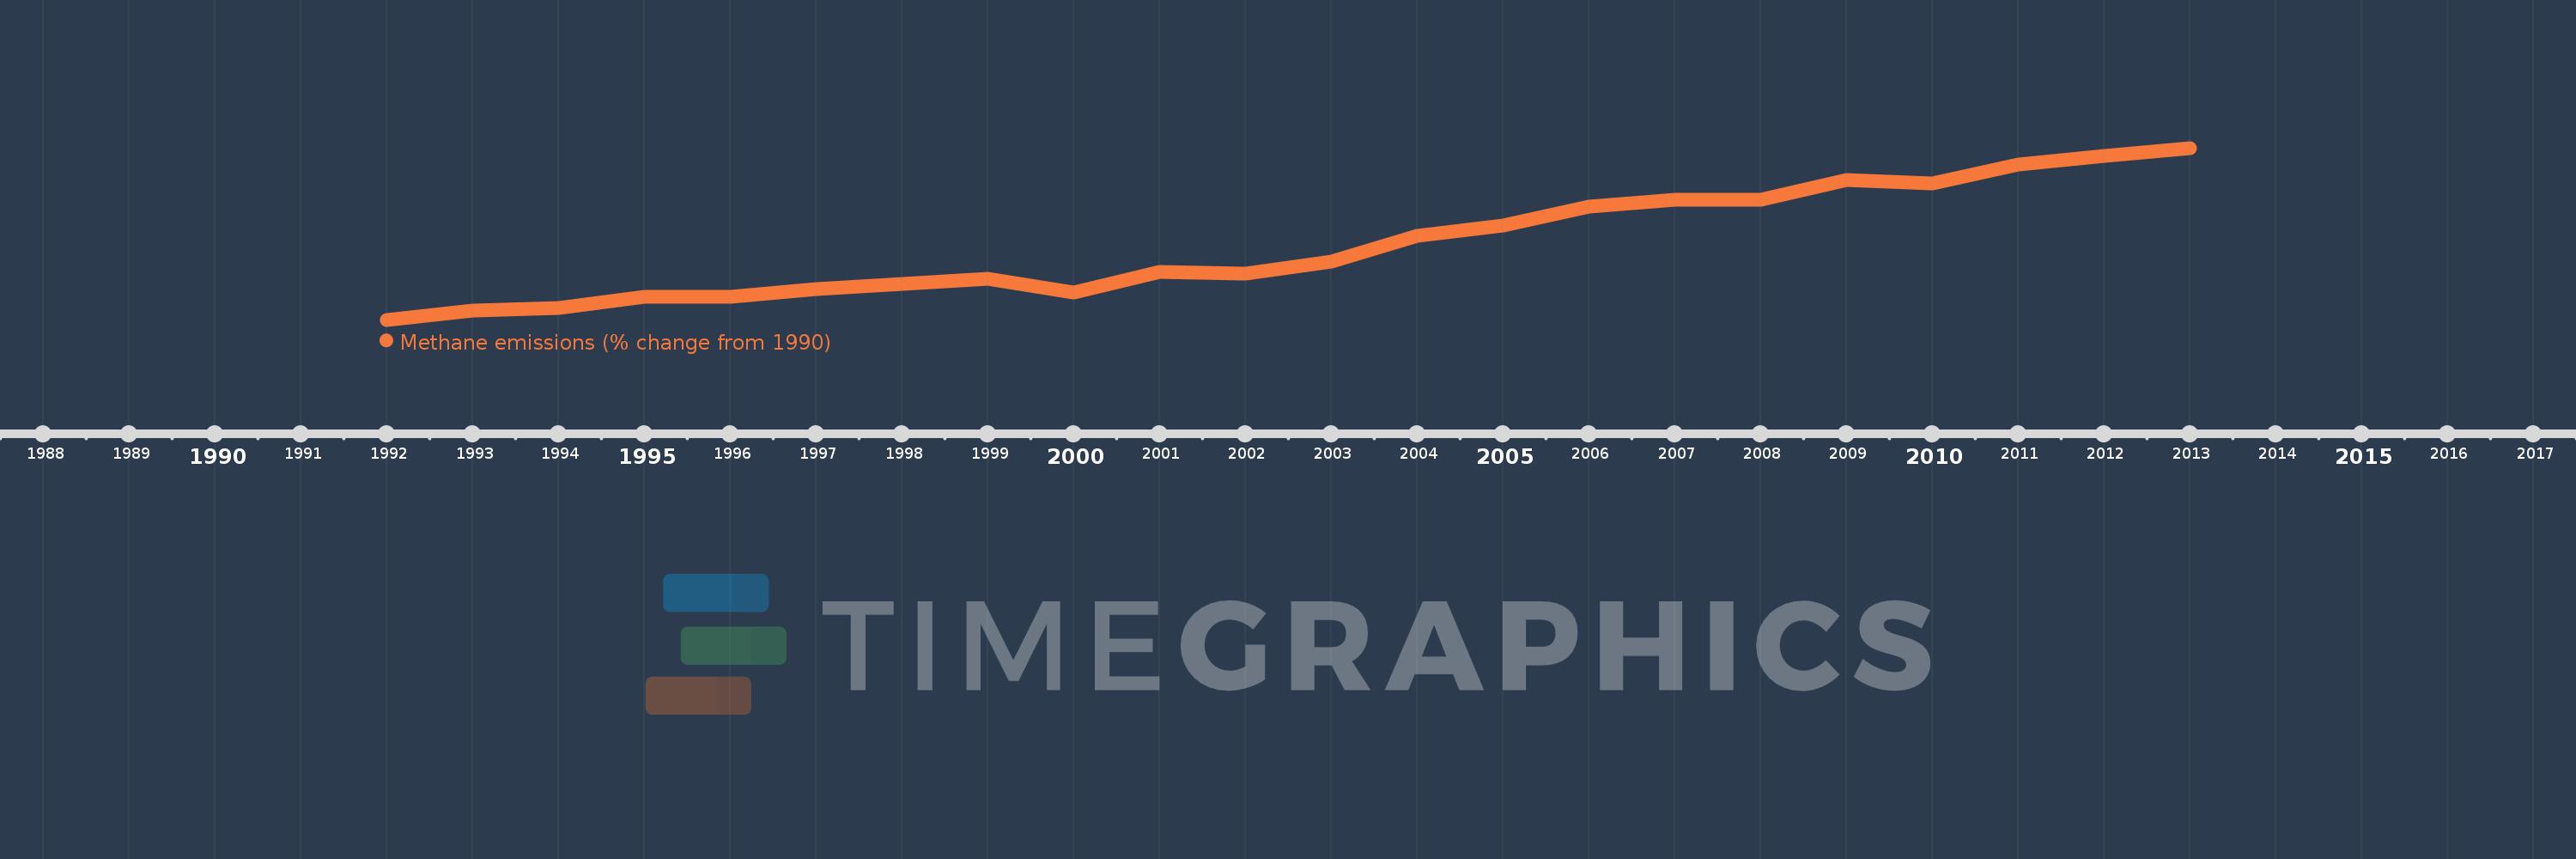
This timeline shows a graph from 1992 to 2013 of Saudi Arabia. No data until 1991. Number of actual observations by date: 22.
Source name:
World Development Indicators
Source organization:
World Bank staff estimates from original source: European Commission, Joint Research Centre (JRC)/Netherlands Environmental Assessment Agency (PBL). Emission Database for Global Atmospheric Research (EDGAR): http://edgar.jrc.ec.europa.eu/.
Categories, topics:
Climate Change, Environment
Last updated:
apr 23, 2017
Indicators value changes by year
Meaning:
54.771
Minimum:
16.225
jan 1, 1992
Maximum:
104.48
jan 1, 2013
At the date of observation
Value
Absolute change
Change from the previous value
jan 1, 1992
16.225
+16.225
0.0%
jan 1, 1993
20.893
+4.667
28.76%
jan 1, 1994
22.365
+1.473
7.05%
jan 1, 1995
28.156
+5.79
25.89%
jan 1, 1996
28.117
-0.038
-0.14%
jan 1, 1997
31.868
+3.751
13.34%
jan 1, 1998
34.568
+2.7
8.47%
jan 1, 1999
37.071
+2.502
7.24%
jan 1, 2000
30.368
-6.702
-18.08%
jan 1, 2001
40.735
+10.367
34.14%
jan 1, 2002
39.979
-0.756
-1.86%
jan 1, 2003
46.02
+6.041
15.11%
jan 1, 2004
59.274
+13.254
28.8%
jan 1, 2005
64.509
+5.236
8.83%
jan 1, 2006
74.153
+9.643
14.95%
jan 1, 2007
77.924
+3.771
5.09%
jan 1, 2008
77.689
-0.235
-0.3%
jan 1, 2009
88.168
+10.479
13.49%
jan 1, 2010
86.076
-2.092
-2.37%
jan 1, 2011
96.049
+9.974
11.59%
jan 1, 2012
100.265
+4.215
4.39%
jan 1, 2013
104.48
+4.215
4.2%
Ranking of countries by current statistics by years