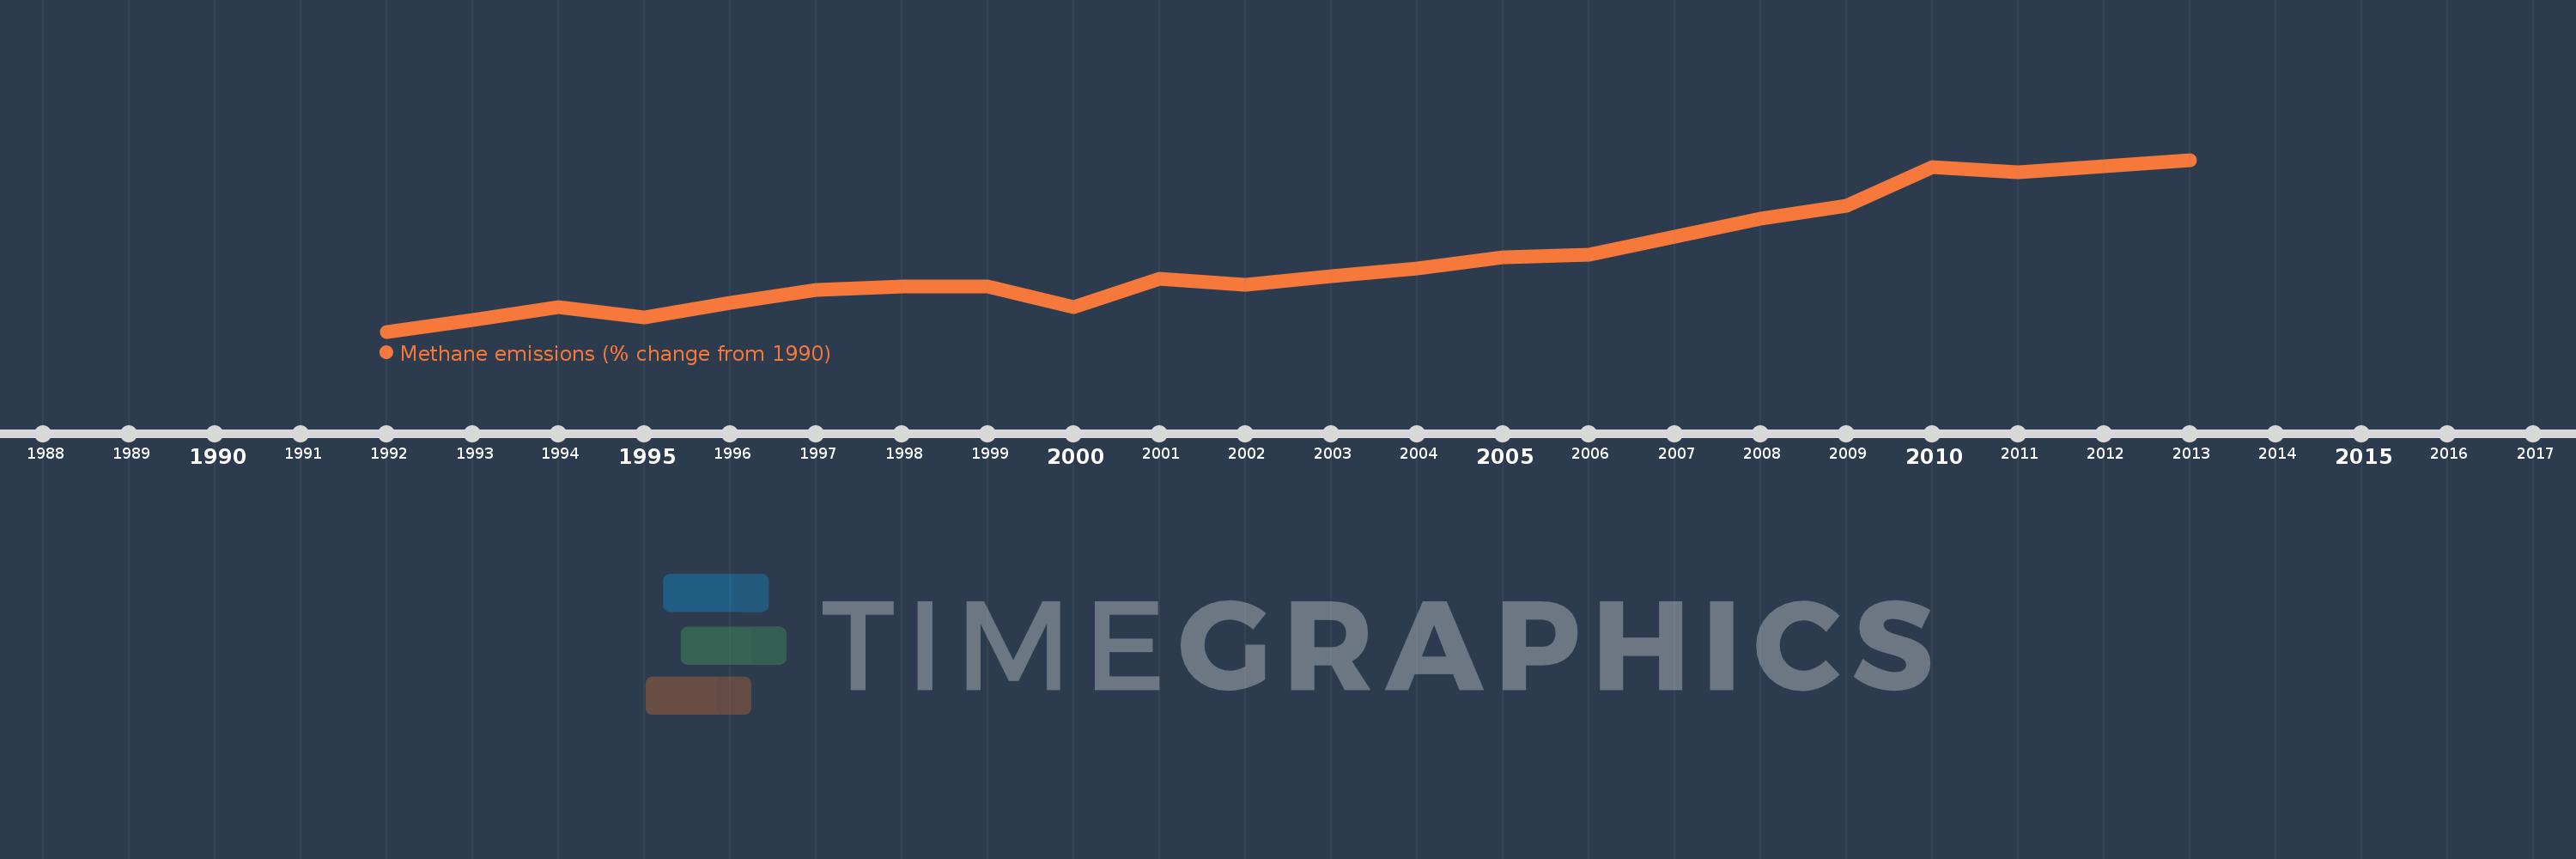
This timeline shows a graph from 1992 to 2013 of Colombia. No data until 1991. Number of actual observations by date: 22.
Source name:
World Development Indicators
Source organization:
World Bank staff estimates from original source: European Commission, Joint Research Centre (JRC)/Netherlands Environmental Assessment Agency (PBL). Emission Database for Global Atmospheric Research (EDGAR): http://edgar.jrc.ec.europa.eu/.
Categories, topics:
Climate Change, Environment
Last updated:
apr 23, 2017
Indicators value changes by year
Meaning:
14.02
Minimum:
-1.574
jan 1, 1992
Maximum:
35.275
jan 1, 2013
At the date of observation
Value
Absolute change
Change from the previous value
jan 1, 1992
-1.574
-1.574
0.0%
jan 1, 1993
0.947
+2.521
-160.14%
jan 1, 1994
3.671
+2.724
287.73%
jan 1, 1995
1.479
-2.192
-59.72%
jan 1, 1996
4.649
+3.17
214.4%
jan 1, 1997
7.352
+2.703
58.14%
jan 1, 1998
8.026
+0.674
9.17%
jan 1, 1999
8.073
+0.047
0.58%
jan 1, 2000
3.644
-4.429
-54.87%
jan 1, 2001
9.683
+6.04
165.76%
jan 1, 2002
8.528
-1.156
-11.93%
jan 1, 2003
10.28
+1.752
20.54%
jan 1, 2004
11.922
+1.642
15.97%
jan 1, 2005
14.421
+2.5
20.97%
jan 1, 2006
14.911
+0.489
3.39%
jan 1, 2007
18.783
+3.872
25.97%
jan 1, 2008
22.581
+3.798
20.22%
jan 1, 2009
25.475
+2.894
12.82%
jan 1, 2010
33.745
+8.27
32.46%
jan 1, 2011
32.623
-1.122
-3.33%
jan 1, 2012
33.949
+1.326
4.07%
jan 1, 2013
35.275
+1.326
3.91%
Ranking of countries by current statistics by years