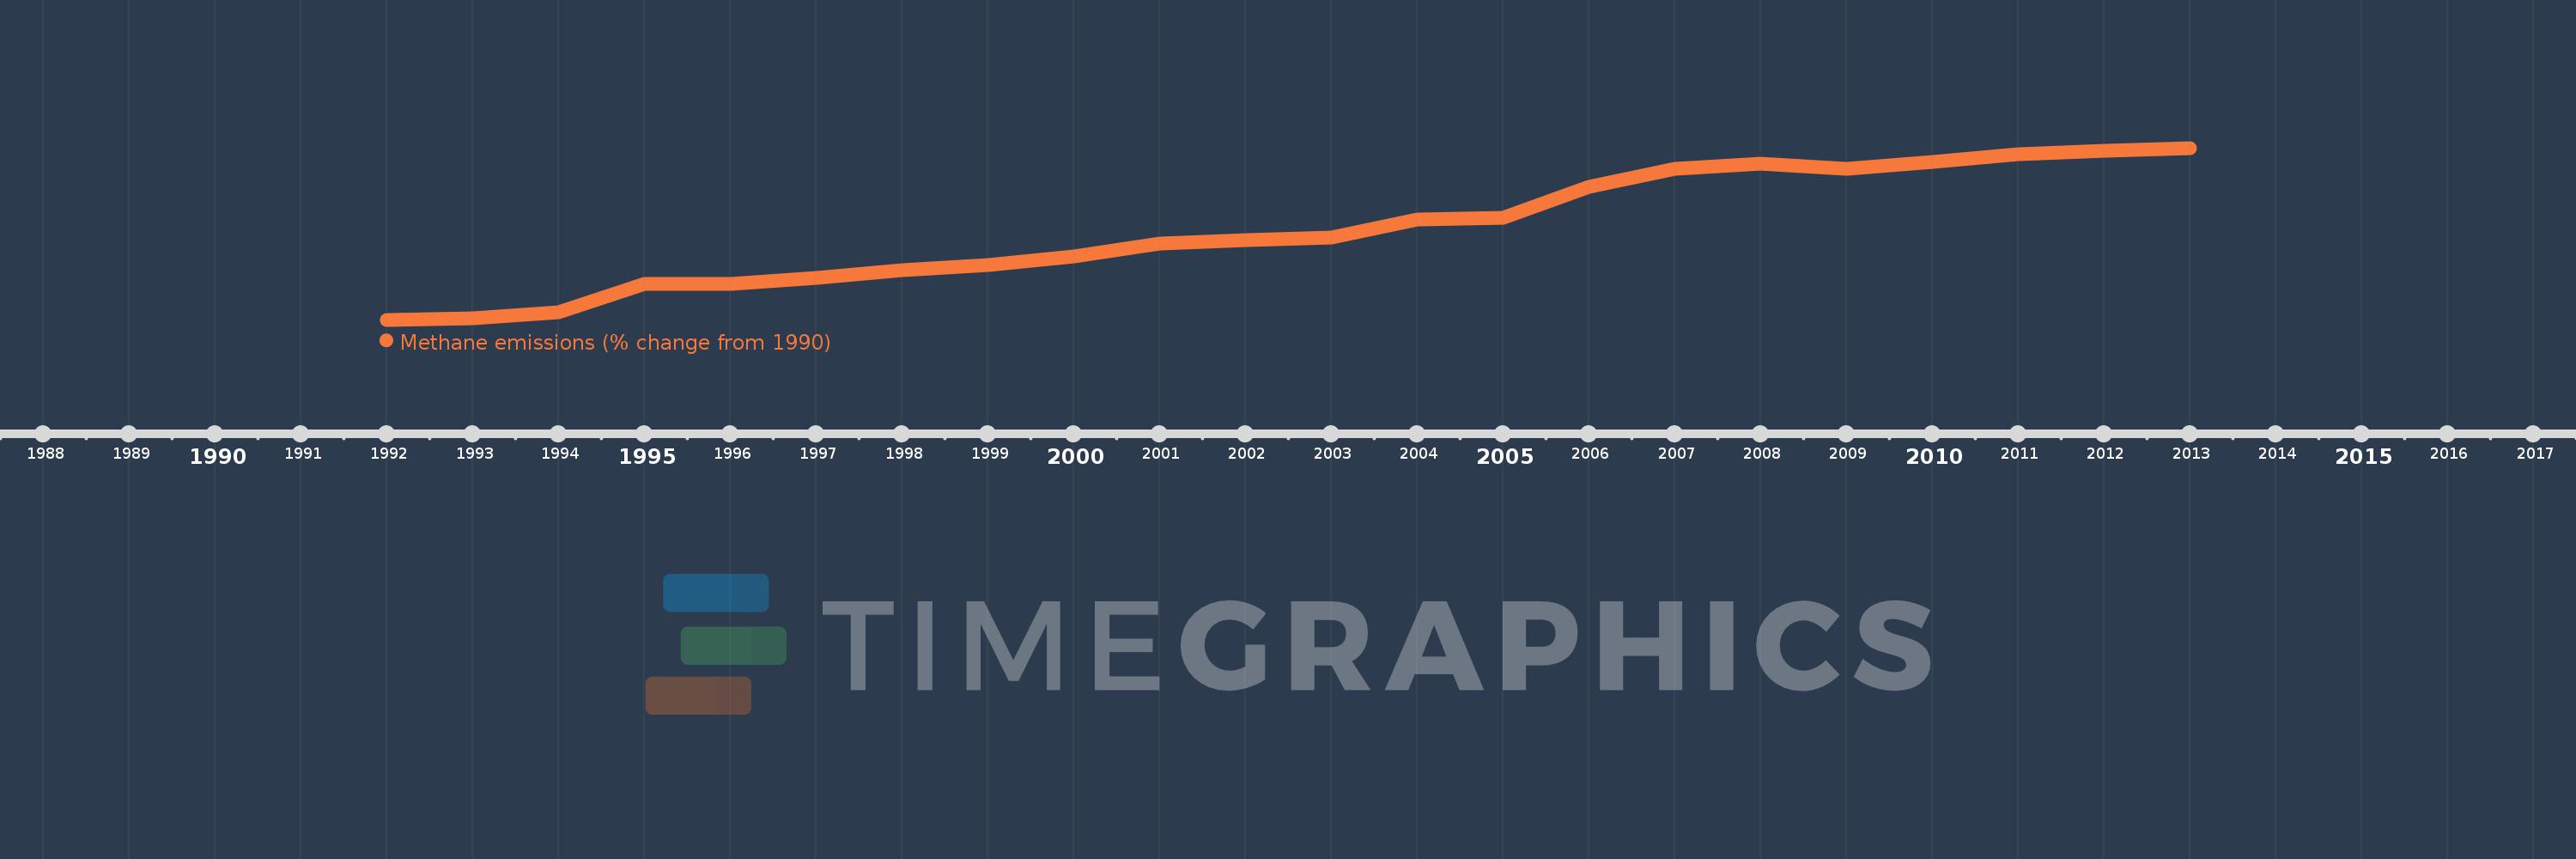
This timeline shows a graph from 1992 to 2013 of Yemen, Rep.. No data until 1991. Number of actual observations by date: 22.
Source name:
World Development Indicators
Source organization:
World Bank staff estimates from original source: European Commission, Joint Research Centre (JRC)/Netherlands Environmental Assessment Agency (PBL). Emission Database for Global Atmospheric Research (EDGAR): http://edgar.jrc.ec.europa.eu/.
Categories, topics:
Climate Change, Environment
Last updated:
apr 23, 2017
Indicators value changes by year
Meaning:
67.23
Minimum:
-0.646
jan 1, 1992
Maximum:
128.515
jan 1, 2013
At the date of observation
Value
Absolute change
Change from the previous value
jan 1, 1992
-0.646
-0.646
0.0%
jan 1, 1993
0.586
+1.232
-190.82%
jan 1, 1994
5.16
+4.573
779.9%
jan 1, 1995
26.225
+21.066
408.29%
jan 1, 1996
26.114
-0.111
-0.42%
jan 1, 1997
30.548
+4.434
16.98%
jan 1, 1998
36.805
+6.257
20.48%
jan 1, 1999
40.545
+3.739
10.16%
jan 1, 2000
47.168
+6.623
16.34%
jan 1, 2001
56.892
+9.724
20.62%
jan 1, 2002
59.332
+2.44
4.29%
jan 1, 2003
61.429
+2.097
3.53%
jan 1, 2004
74.667
+13.238
21.55%
jan 1, 2005
75.709
+1.042
1.4%
jan 1, 2006
99.065
+23.356
30.85%
jan 1, 2007
113.138
+14.074
14.21%
jan 1, 2008
116.661
+3.522
3.11%
jan 1, 2009
112.659
-4.001
-3.43%
jan 1, 2010
118.173
+5.514
4.89%
jan 1, 2011
124.034
+5.861
4.96%
jan 1, 2012
126.275
+2.24
1.81%
jan 1, 2013
128.515
+2.24
1.77%
Ranking of countries by current statistics by years