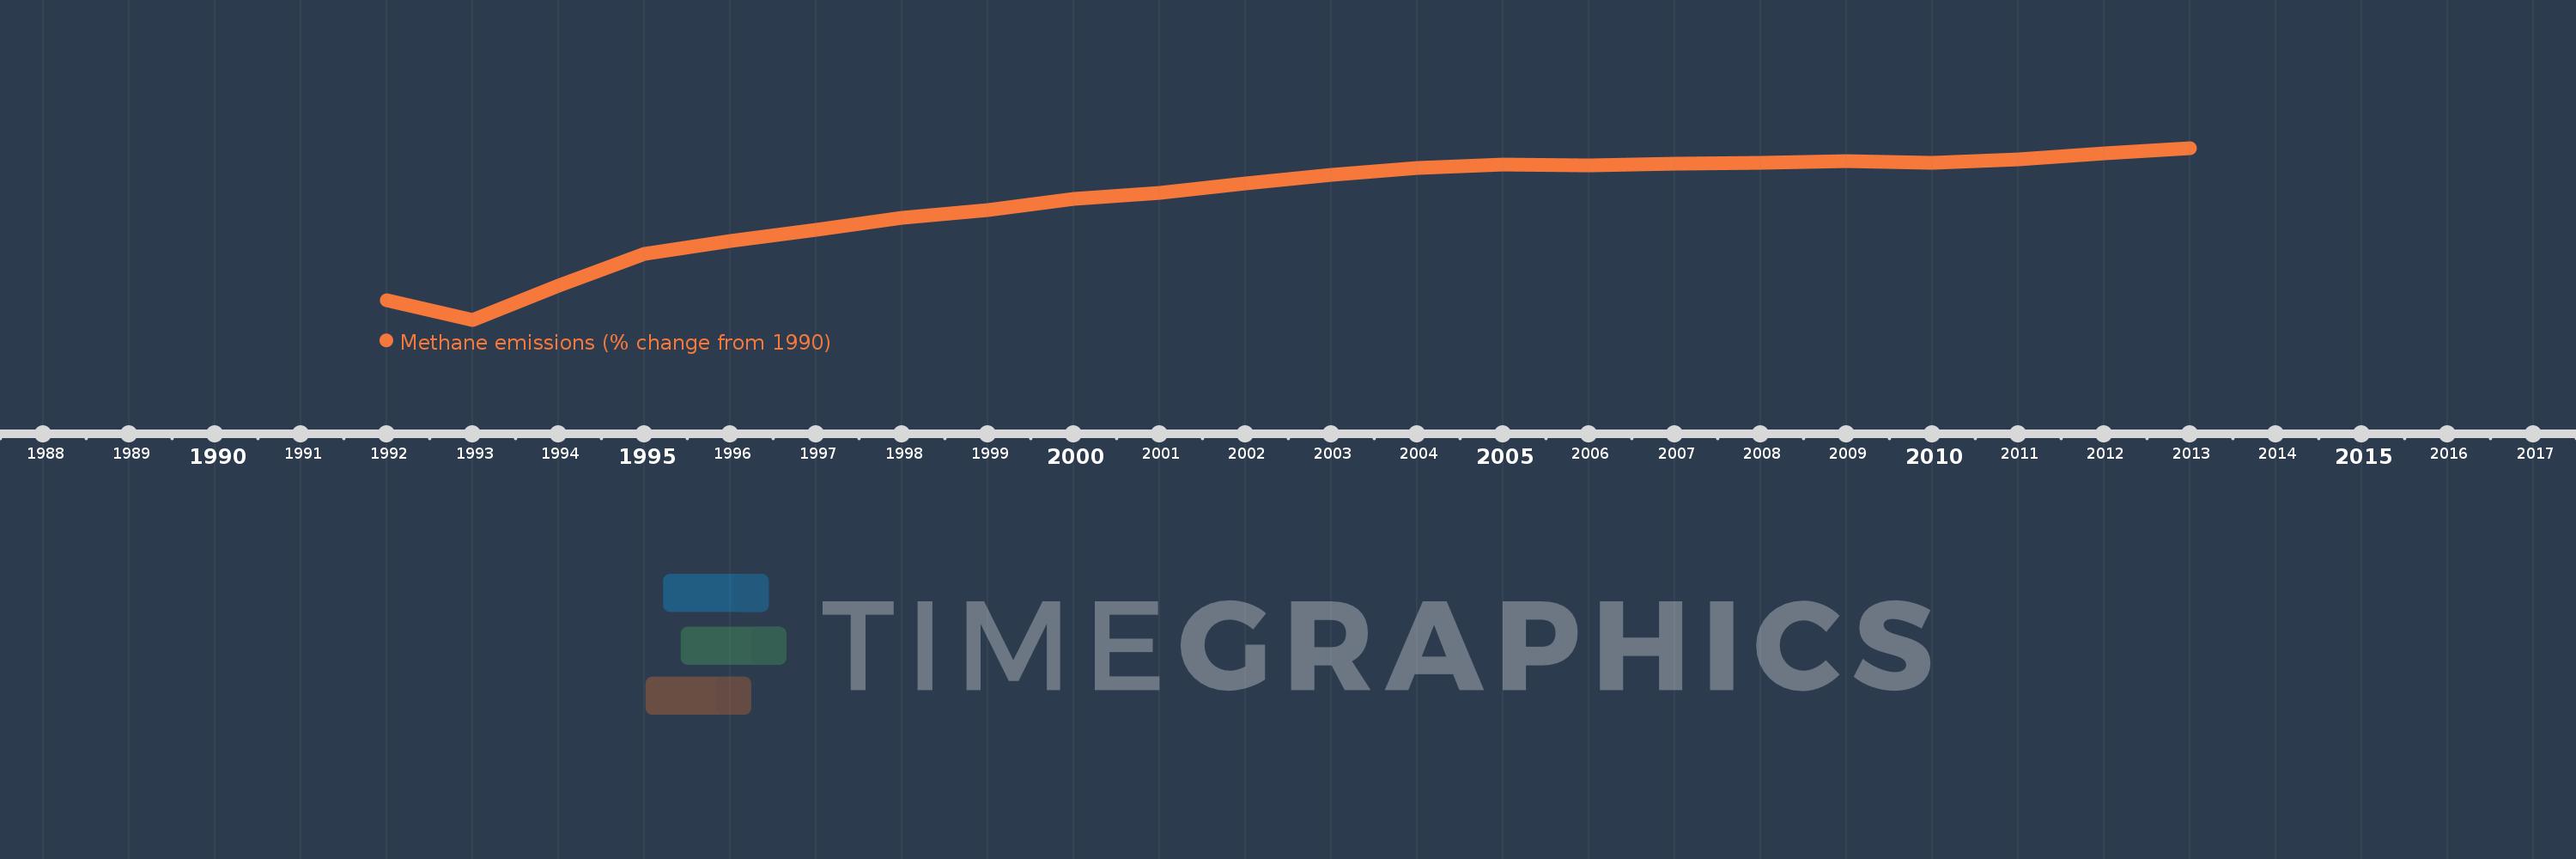
This timeline shows a graph from 1992 to 2013 of Somalia. No data until 1991. Number of actual observations by date: 22.
Source name:
World Development Indicators
Source organization:
World Bank staff estimates from original source: European Commission, Joint Research Centre (JRC)/Netherlands Environmental Assessment Agency (PBL). Emission Database for Global Atmospheric Research (EDGAR): http://edgar.jrc.ec.europa.eu/.
Categories, topics:
Climate Change, Environment
Last updated:
apr 23, 2017
Indicators value changes by year
Meaning:
13.005
Minimum:
-11.958
jan 1, 1993
Maximum:
24.065
jan 1, 2013
At the date of observation
Value
Absolute change
Change from the previous value
jan 1, 1992
-7.832
-7.832
0.0%
jan 1, 1993
-11.958
-4.126
52.67%
jan 1, 1994
-4.868
+7.09
-59.29%
jan 1, 1995
1.911
+6.779
-139.25%
jan 1, 1996
4.555
+2.644
138.38%
jan 1, 1997
6.967
+2.412
52.94%
jan 1, 1998
9.502
+2.536
36.4%
jan 1, 1999
11.06
+1.558
16.4%
jan 1, 2000
13.335
+2.275
20.57%
jan 1, 2001
14.675
+1.34
10.05%
jan 1, 2002
16.662
+1.987
13.54%
jan 1, 2003
18.479
+1.817
10.9%
jan 1, 2004
19.95
+1.471
7.96%
jan 1, 2005
20.642
+0.692
3.47%
jan 1, 2006
20.403
-0.24
-1.16%
jan 1, 2007
20.765
+0.362
1.77%
jan 1, 2008
20.938
+0.173
0.83%
jan 1, 2009
21.351
+0.413
1.97%
jan 1, 2010
21.029
-0.322
-1.51%
jan 1, 2011
21.632
+0.603
2.87%
jan 1, 2012
22.849
+1.216
5.62%
jan 1, 2013
24.065
+1.216
5.32%
Ranking of countries by current statistics by years