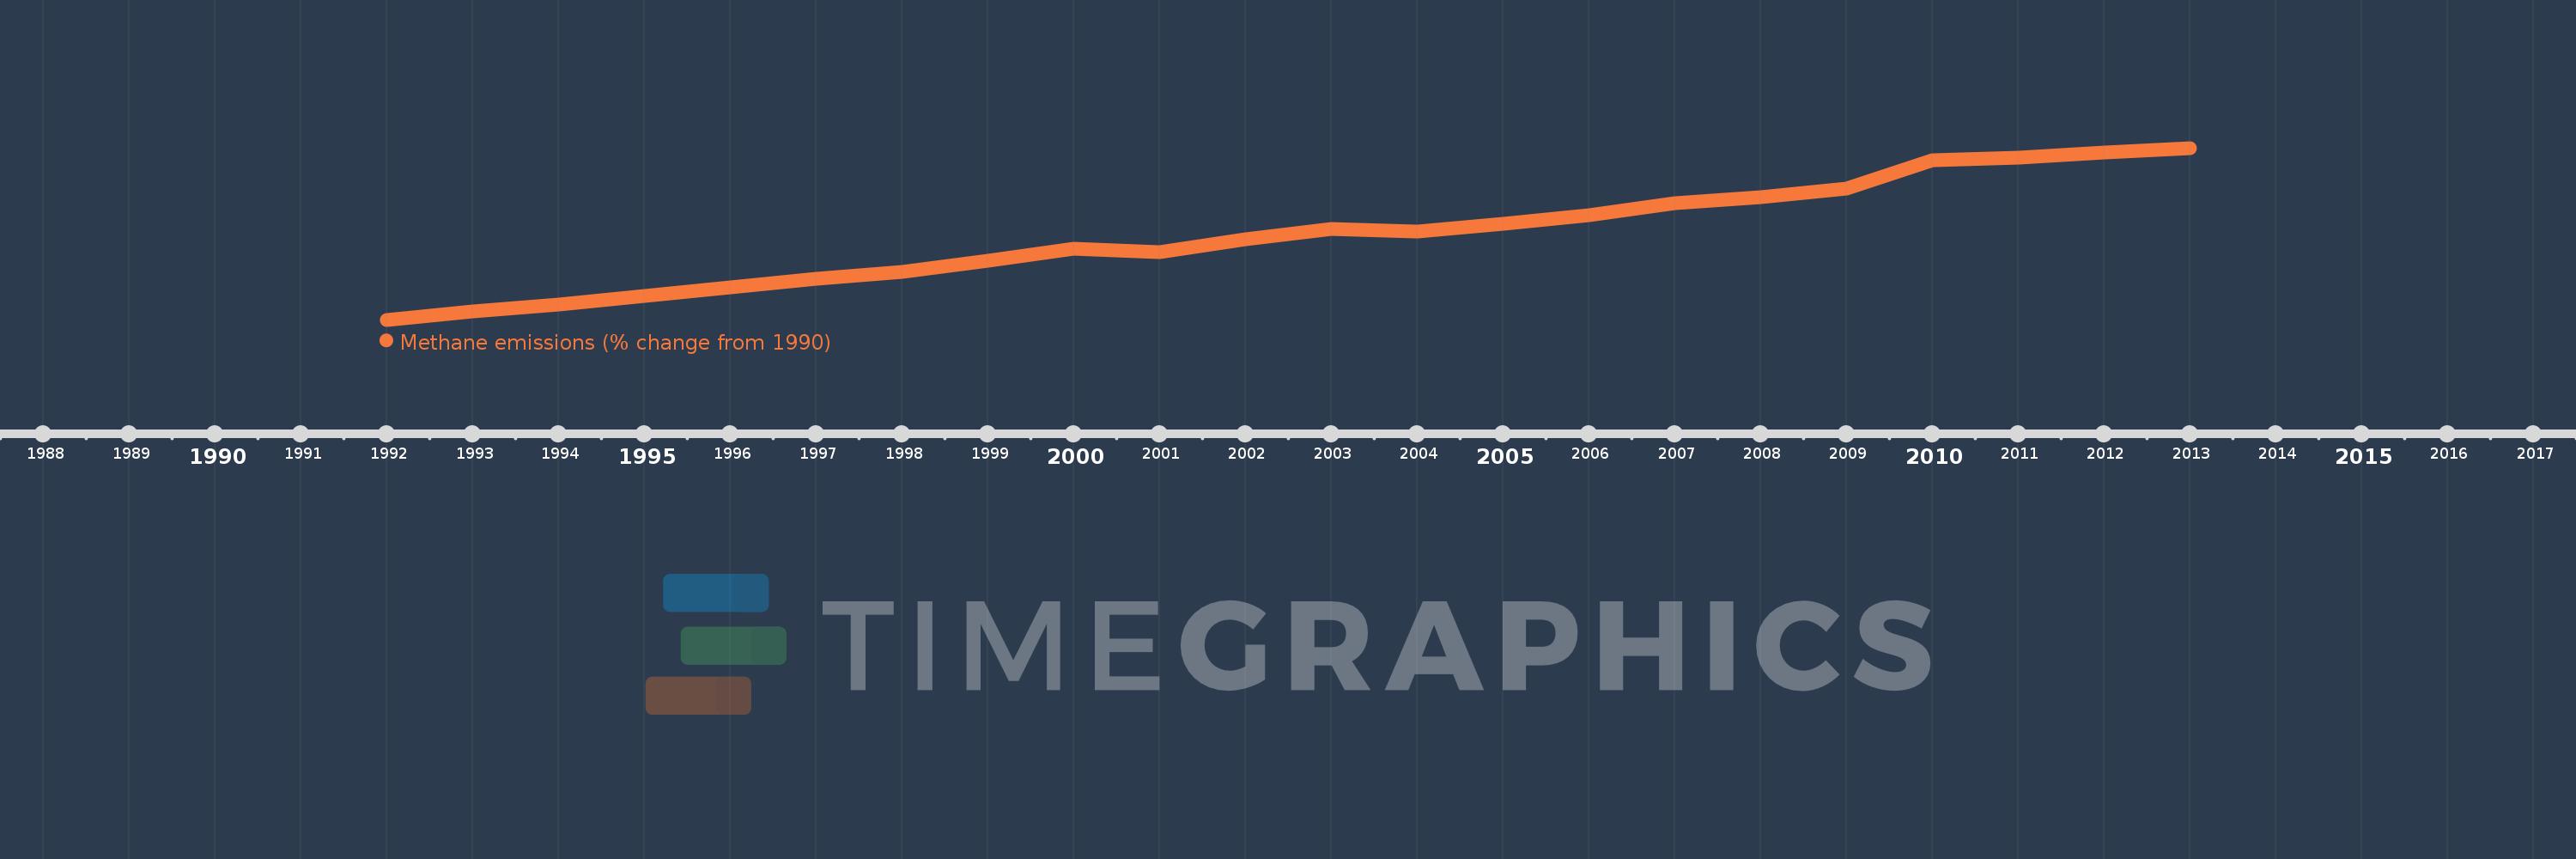
This timeline shows a graph from 1992 to 2013 of Comoros. No data until 1991. Number of actual observations by date: 22.
Source name:
World Development Indicators
Source organization:
World Bank staff estimates from original source: European Commission, Joint Research Centre (JRC)/Netherlands Environmental Assessment Agency (PBL). Emission Database for Global Atmospheric Research (EDGAR): http://edgar.jrc.ec.europa.eu/.
Categories, topics:
Climate Change, Environment
Last updated:
apr 23, 2017
Indicators value changes by year
Meaning:
28.894
Minimum:
2.019
jan 1, 1992
Maximum:
56.734
jan 1, 2013
At the date of observation
Value
Absolute change
Change from the previous value
jan 1, 1992
2.019
+2.019
0.0%
jan 1, 1993
4.639
+2.62
129.79%
jan 1, 1994
6.784
+2.146
46.26%
jan 1, 1995
9.56
+2.776
40.92%
jan 1, 1996
12.339
+2.779
29.06%
jan 1, 1997
15.085
+2.746
22.25%
jan 1, 1998
17.195
+2.11
13.99%
jan 1, 1999
20.682
+3.487
20.28%
jan 1, 2000
24.613
+3.931
19.01%
jan 1, 2001
23.653
-0.96
-3.9%
jan 1, 2002
27.758
+4.105
17.35%
jan 1, 2003
31.068
+3.31
11.93%
jan 1, 2004
30.016
-1.052
-3.39%
jan 1, 2005
32.604
+2.589
8.62%
jan 1, 2006
35.329
+2.724
8.36%
jan 1, 2007
39.095
+3.767
10.66%
jan 1, 2008
40.949
+1.853
4.74%
jan 1, 2009
43.87
+2.921
7.13%
jan 1, 2010
52.823
+8.954
20.41%
jan 1, 2011
53.661
+0.838
1.59%
jan 1, 2012
55.198
+1.537
2.86%
jan 1, 2013
56.734
+1.537
2.78%
Ranking of countries by current statistics by years