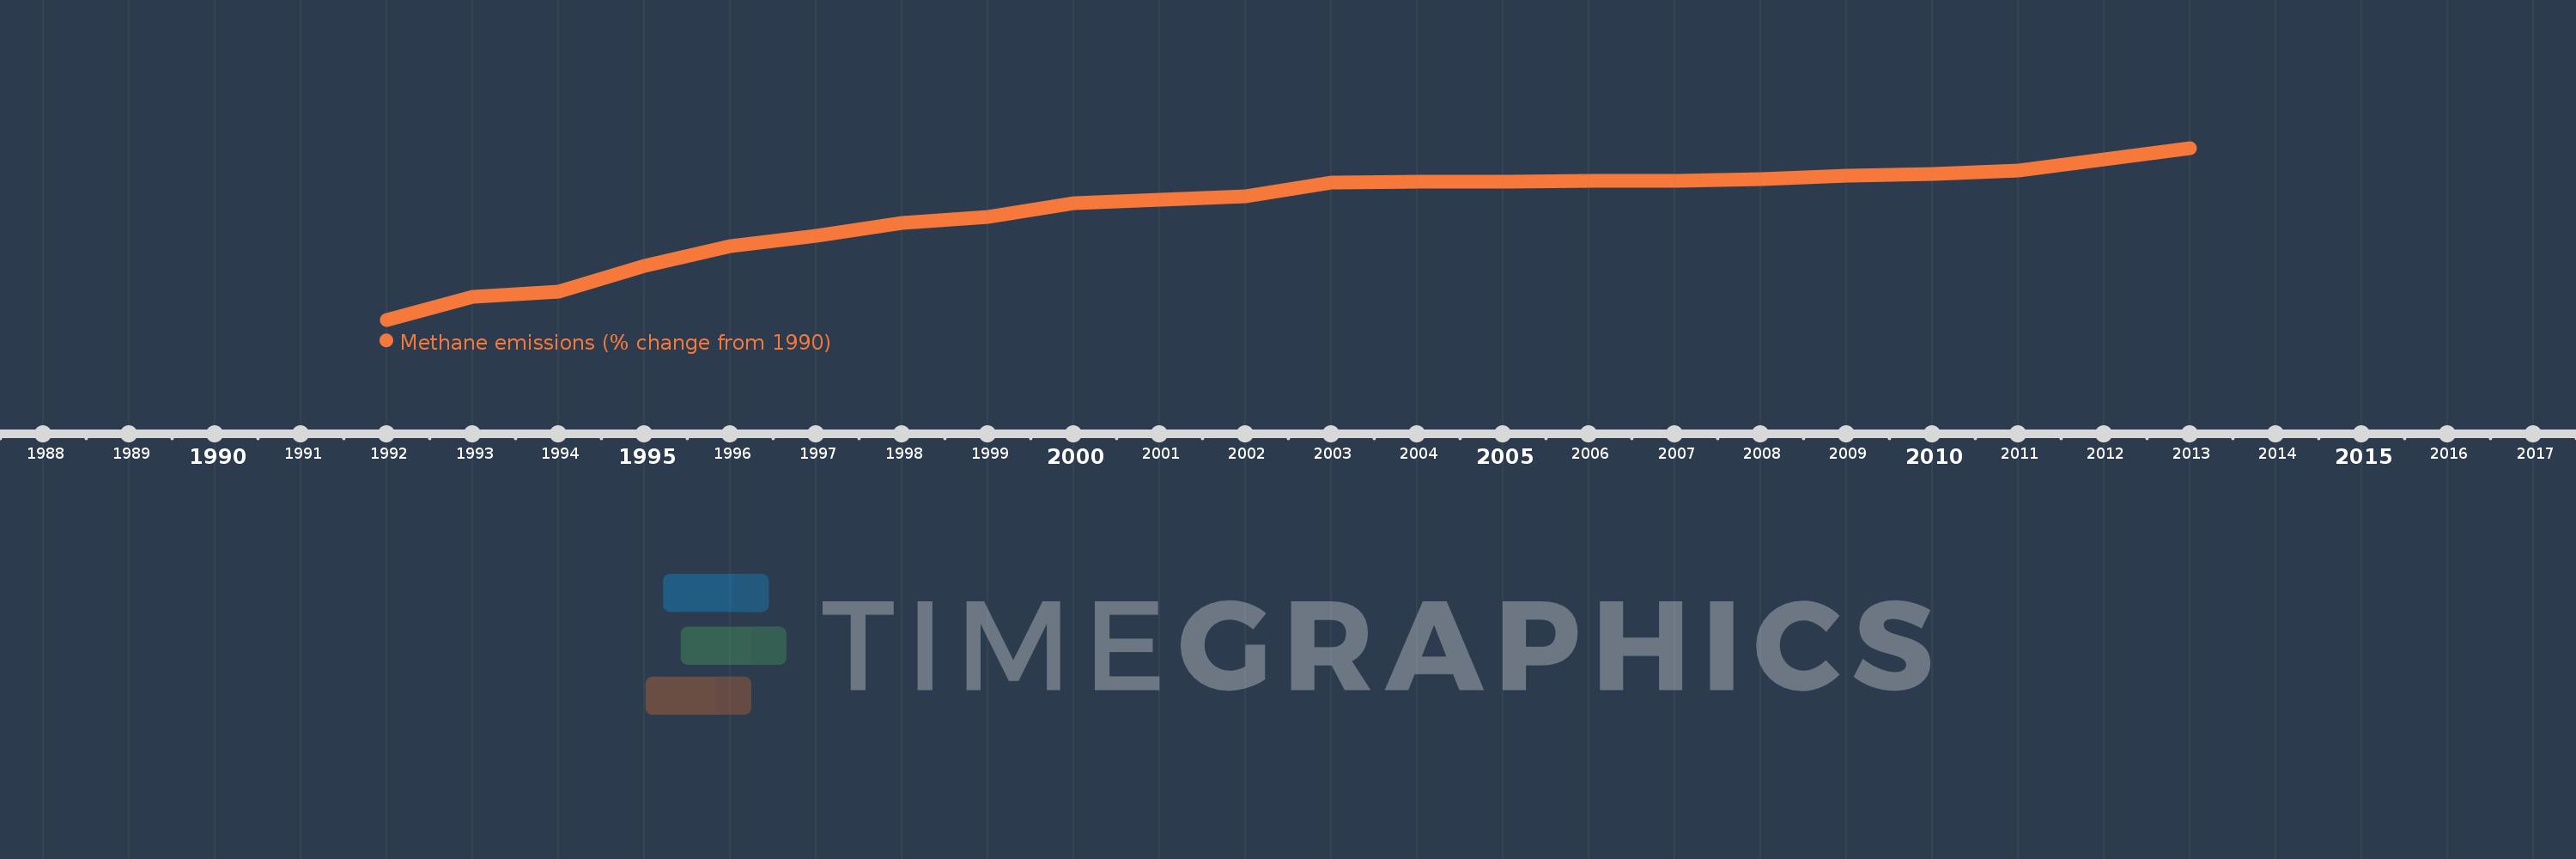
This timeline shows a graph from 1992 to 2013 of Tuvalu. No data until 1991. Number of actual observations by date: 22.
Source name:
World Development Indicators
Source organization:
World Bank staff estimates from original source: European Commission, Joint Research Centre (JRC)/Netherlands Environmental Assessment Agency (PBL). Emission Database for Global Atmospheric Research (EDGAR): http://edgar.jrc.ec.europa.eu/.
Categories, topics:
Climate Change, Environment
Last updated:
apr 23, 2017
Indicators value changes by year
Meaning:
18.987
Minimum:
7.109
jan 1, 1992
Maximum:
25.609
jan 1, 2013
At the date of observation
Value
Absolute change
Change from the previous value
jan 1, 1992
7.109
+7.109
0.0%
jan 1, 1993
9.573
+2.464
34.66%
jan 1, 1994
10.146
+0.573
5.98%
jan 1, 1995
12.953
+2.807
27.66%
jan 1, 1996
15.036
+2.083
16.08%
jan 1, 1997
16.187
+1.152
7.66%
jan 1, 1998
17.541
+1.354
8.36%
jan 1, 1999
18.215
+0.674
3.84%
jan 1, 2000
19.687
+1.473
8.09%
jan 1, 2001
20.057
+0.37
1.88%
jan 1, 2002
20.419
+0.362
1.8%
jan 1, 2003
21.89
+1.471
7.21%
jan 1, 2004
21.954
+0.063
0.29%
jan 1, 2005
21.992
+0.038
0.18%
jan 1, 2006
22.029
+0.037
0.17%
jan 1, 2007
22.068
+0.038
0.17%
jan 1, 2008
22.292
+0.225
1.02%
jan 1, 2009
22.589
+0.297
1.33%
jan 1, 2010
22.834
+0.244
1.08%
jan 1, 2011
23.146
+0.313
1.37%
jan 1, 2012
24.378
+1.231
5.32%
jan 1, 2013
25.609
+1.231
5.05%
Ranking of countries by current statistics by years