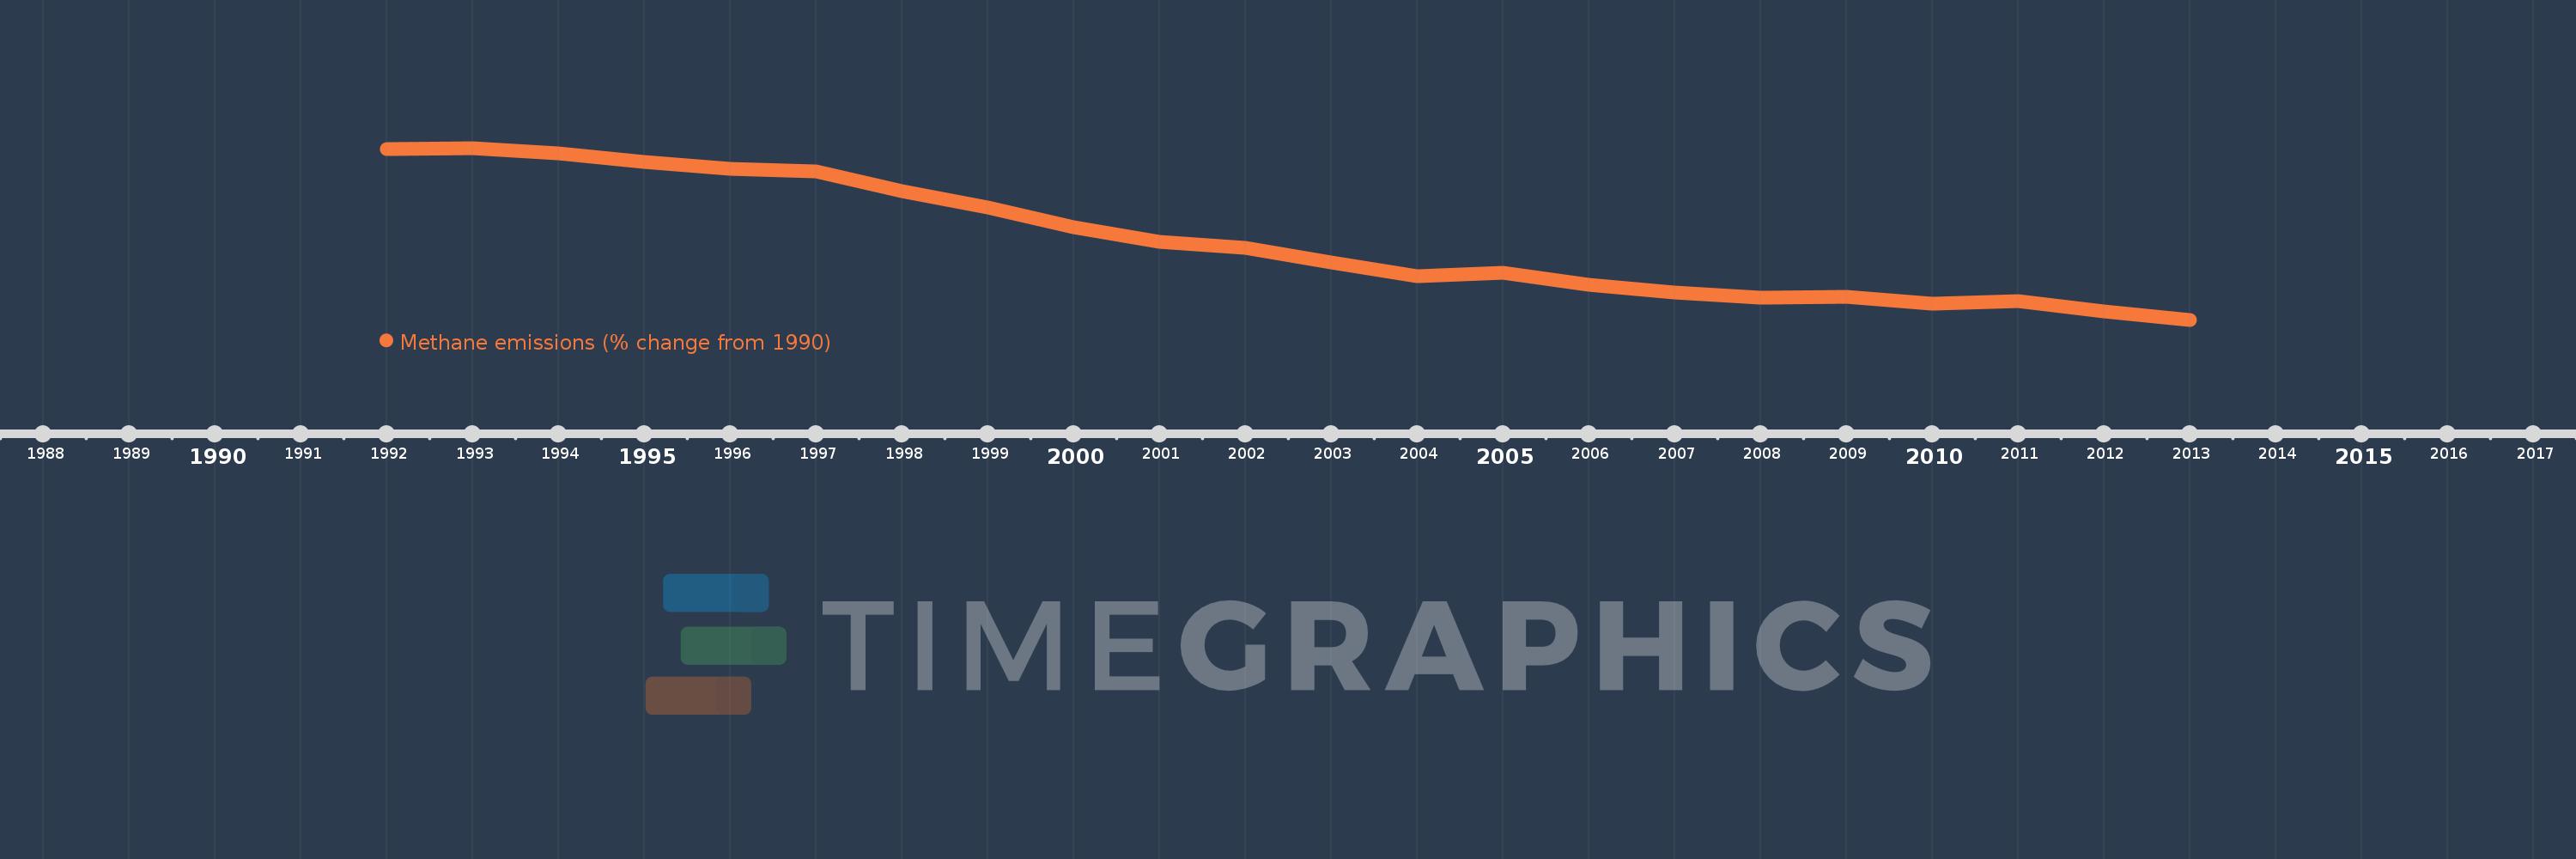
This timeline shows a graph from 1992 to 2013 of Netherlands. No data until 1991. Number of actual observations by date: 22.
Source name:
World Development Indicators
Source organization:
World Bank staff estimates from original source: European Commission, Joint Research Centre (JRC)/Netherlands Environmental Assessment Agency (PBL). Emission Database for Global Atmospheric Research (EDGAR): http://edgar.jrc.ec.europa.eu/.
Categories, topics:
Climate Change, Environment
Last updated:
apr 23, 2017
Indicators value changes by year
Meaning:
-18.777
Minimum:
-36.936
jan 1, 2013
Maximum:
2.342
jan 1, 1993
At the date of observation
Value
Absolute change
Change from the previous value
jan 1, 1992
2.092
+2.092
0.0%
jan 1, 1993
2.342
+0.251
11.98%
jan 1, 1994
1.136
-1.207
-51.51%
jan 1, 1995
-0.817
-1.952
-171.92%
jan 1, 1996
-2.41
-1.593
195.05%
jan 1, 1997
-2.962
-0.553
22.93%
jan 1, 1998
-7.626
-4.664
157.44%
jan 1, 1999
-11.331
-3.705
48.59%
jan 1, 2000
-15.728
-4.397
38.81%
jan 1, 2001
-19.083
-3.354
21.33%
jan 1, 2002
-20.404
-1.321
6.92%
jan 1, 2003
-23.809
-3.405
16.69%
jan 1, 2004
-26.922
-3.113
13.07%
jan 1, 2005
-26.182
+0.74
-2.75%
jan 1, 2006
-29.001
-2.819
10.77%
jan 1, 2007
-30.804
-1.803
6.22%
jan 1, 2008
-31.905
-1.102
3.58%
jan 1, 2009
-31.751
+0.154
-0.48%
jan 1, 2010
-33.188
-1.438
4.53%
jan 1, 2011
-32.751
+0.437
-1.32%
jan 1, 2012
-35.055
-2.304
7.03%
jan 1, 2013
-36.936
-1.88
5.36%
Ranking of countries by current statistics by years