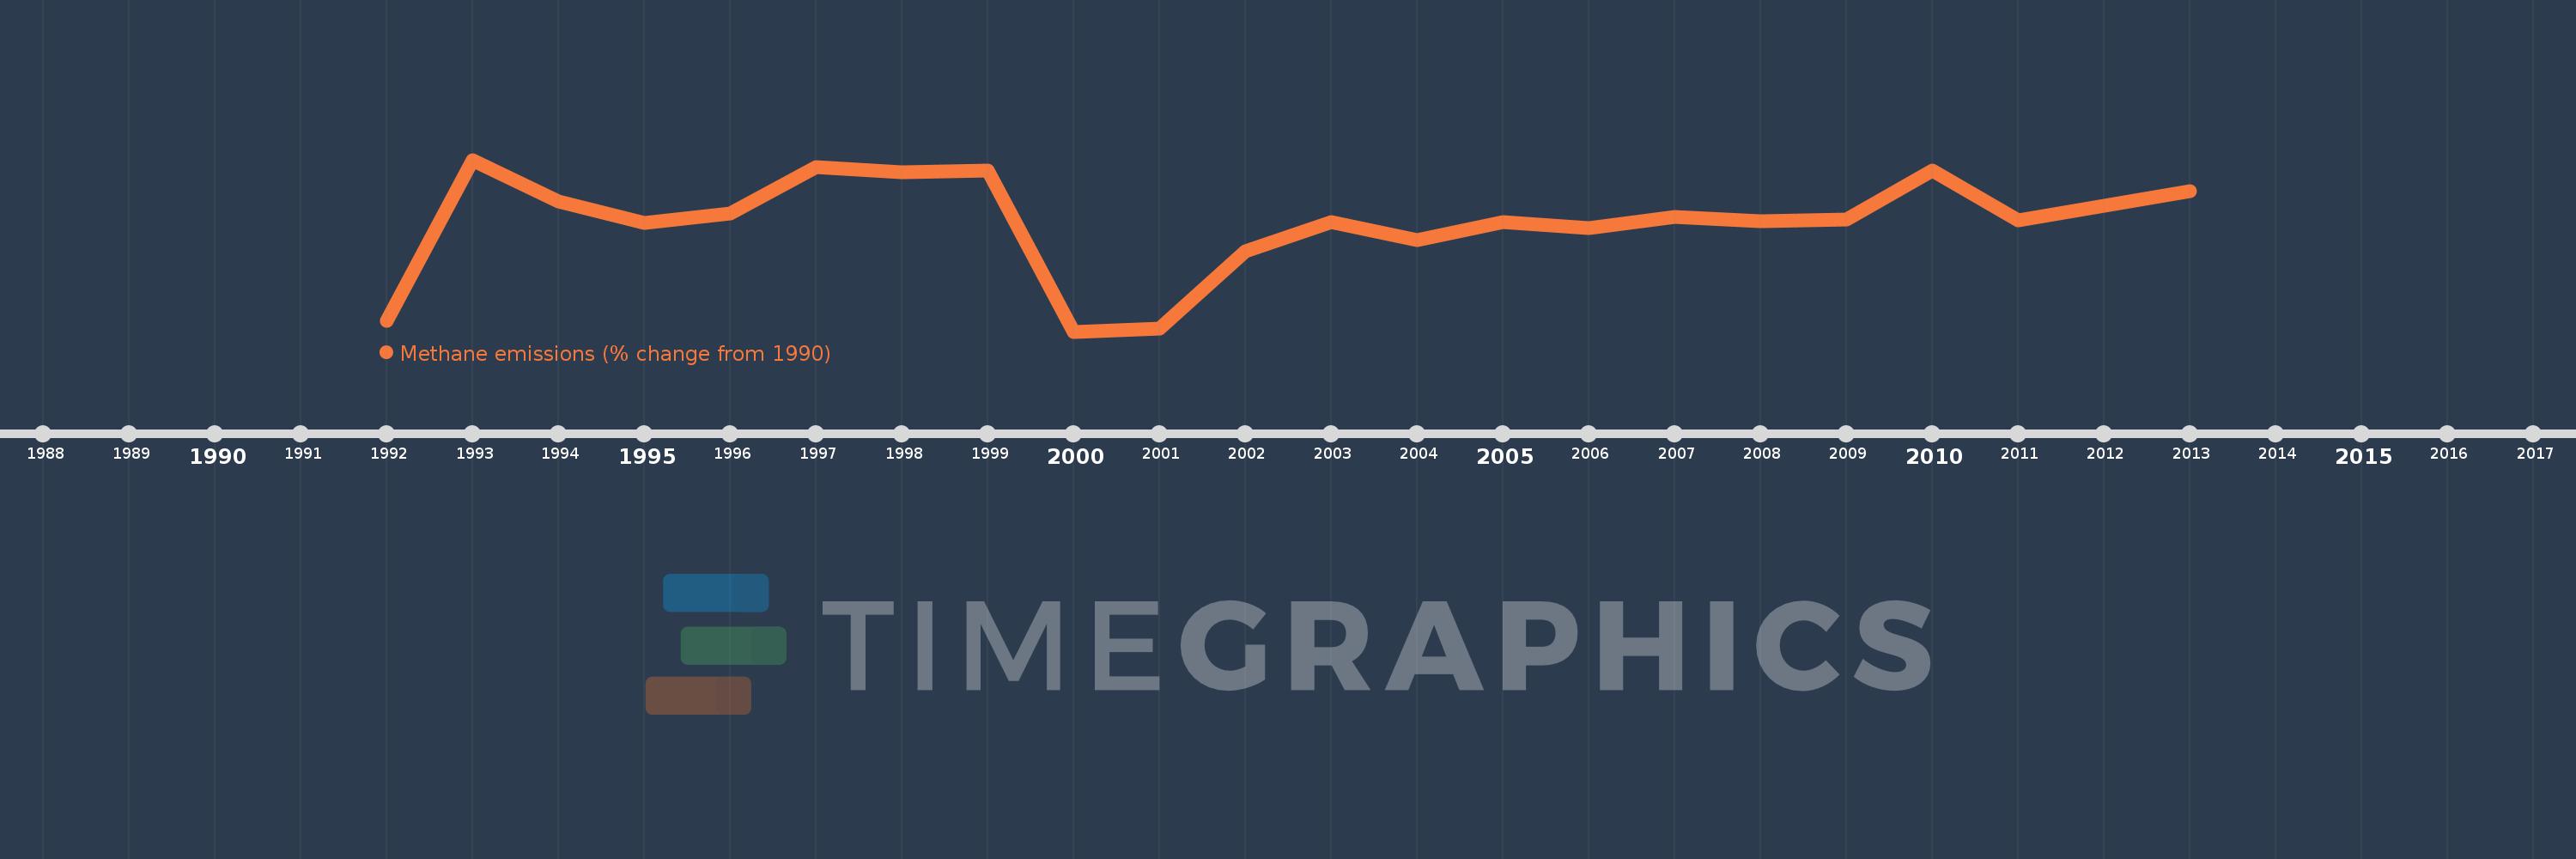
This timeline shows a graph from 1992 to 2013 of Dominican Republic. No data until 1991. Number of actual observations by date: 22.
Source name:
World Development Indicators
Source organization:
World Bank staff estimates from original source: European Commission, Joint Research Centre (JRC)/Netherlands Environmental Assessment Agency (PBL). Emission Database for Global Atmospheric Research (EDGAR): http://edgar.jrc.ec.europa.eu/.
Categories, topics:
Climate Change, Environment
Last updated:
apr 23, 2017
Indicators value changes by year
Meaning:
11.912
Minimum:
3.657
jan 1, 2000
Maximum:
16.669
jan 1, 1993
At the date of observation
Value
Absolute change
Change from the previous value
jan 1, 1992
4.463
+4.463
0.0%
jan 1, 1993
16.669
+12.206
273.53%
jan 1, 1994
13.531
-3.138
-18.82%
jan 1, 1995
11.918
-1.614
-11.93%
jan 1, 1996
12.633
+0.715
6.0%
jan 1, 1997
16.122
+3.489
27.62%
jan 1, 1998
15.745
-0.377
-2.34%
jan 1, 1999
15.88
+0.135
0.86%
jan 1, 2000
3.657
-12.223
-76.97%
jan 1, 2001
3.894
+0.237
6.47%
jan 1, 2002
9.714
+5.821
149.49%
jan 1, 2003
11.942
+2.227
22.93%
jan 1, 2004
10.616
-1.326
-11.1%
jan 1, 2005
11.977
+1.36
12.82%
jan 1, 2006
11.484
-0.492
-4.11%
jan 1, 2007
12.323
+0.839
7.3%
jan 1, 2008
12.025
-0.298
-2.42%
jan 1, 2009
12.117
+0.092
0.77%
jan 1, 2010
15.848
+3.731
30.79%
jan 1, 2011
12.051
-3.797
-23.96%
jan 1, 2012
13.171
+1.121
9.3%
jan 1, 2013
14.292
+1.121
8.51%
Ranking of countries by current statistics by years