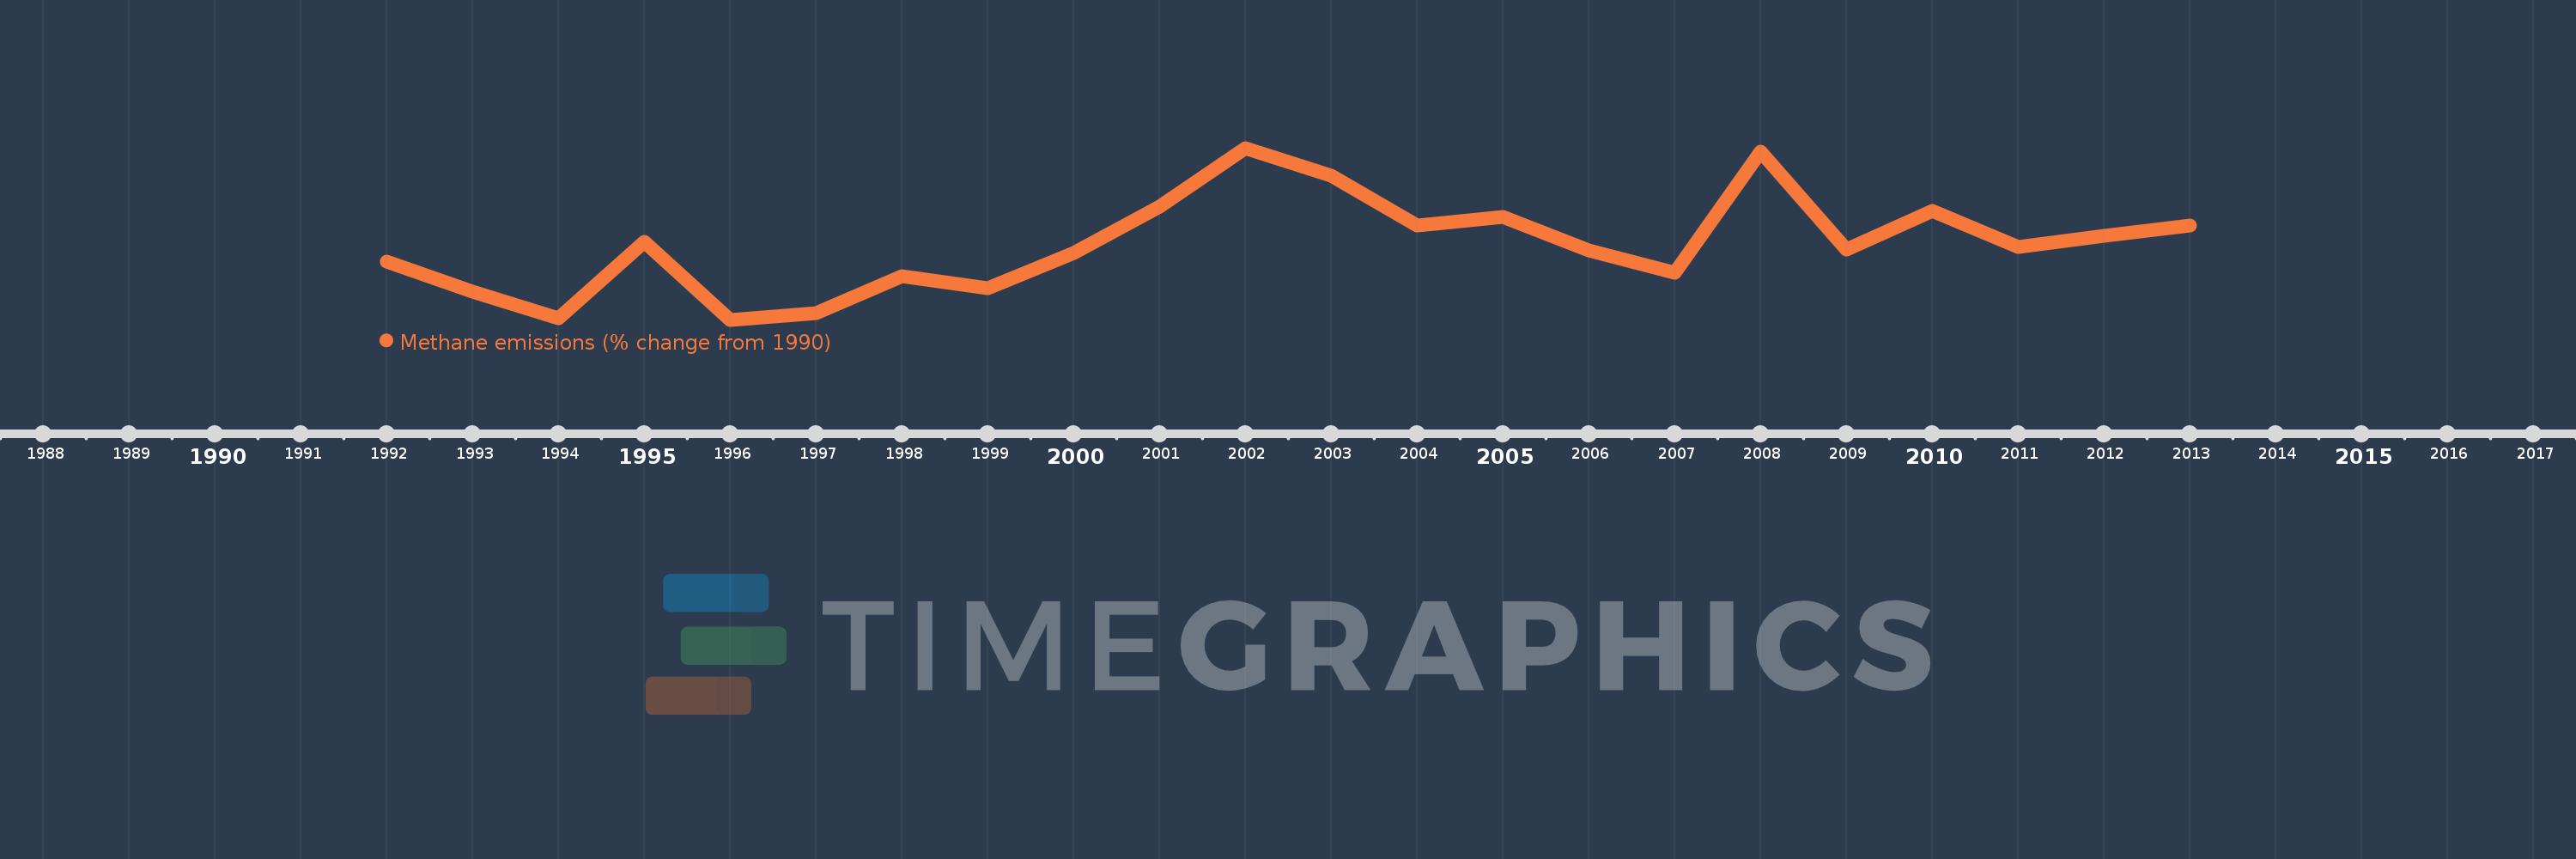
This timeline shows a graph from 1992 to 2013 of Australia. No data until 1991. Number of actual observations by date: 22.
Source name:
World Development Indicators
Source organization:
World Bank staff estimates from original source: European Commission, Joint Research Centre (JRC)/Netherlands Environmental Assessment Agency (PBL). Emission Database for Global Atmospheric Research (EDGAR): http://edgar.jrc.ec.europa.eu/.
Categories, topics:
Climate Change, Environment
Last updated:
apr 23, 2017
Indicators value changes by year
Meaning:
6.756
Minimum:
-2.182
jan 1, 1996
Maximum:
18.234
jan 1, 2002
At the date of observation
Value
Absolute change
Change from the previous value
jan 1, 1992
4.734
+4.734
0.0%
jan 1, 1993
1.175
-3.559
-75.18%
jan 1, 1994
-2.01
-3.185
-271.03%
jan 1, 1995
7.063
+9.073
-451.47%
jan 1, 1996
-2.182
-9.245
-130.9%
jan 1, 1997
-1.42
+0.762
-34.94%
jan 1, 1998
3.018
+4.438
-312.54%
jan 1, 1999
1.532
-1.486
-49.24%
jan 1, 2000
5.76
+4.228
276.02%
jan 1, 2001
11.275
+5.515
95.73%
jan 1, 2002
18.234
+6.96
61.73%
jan 1, 2003
14.898
-3.337
-18.3%
jan 1, 2004
9.013
-5.884
-39.5%
jan 1, 2005
10.058
+1.045
11.59%
jan 1, 2006
6.098
-3.96
-39.37%
jan 1, 2007
3.417
-2.681
-43.96%
jan 1, 2008
17.77
+14.353
420.0%
jan 1, 2009
6.162
-11.608
-65.33%
jan 1, 2010
10.753
+4.591
74.52%
jan 1, 2011
6.447
-4.306
-40.04%
jan 1, 2012
7.773
+1.326
20.56%
jan 1, 2013
9.065
+1.292
16.62%
Ranking of countries by current statistics by years