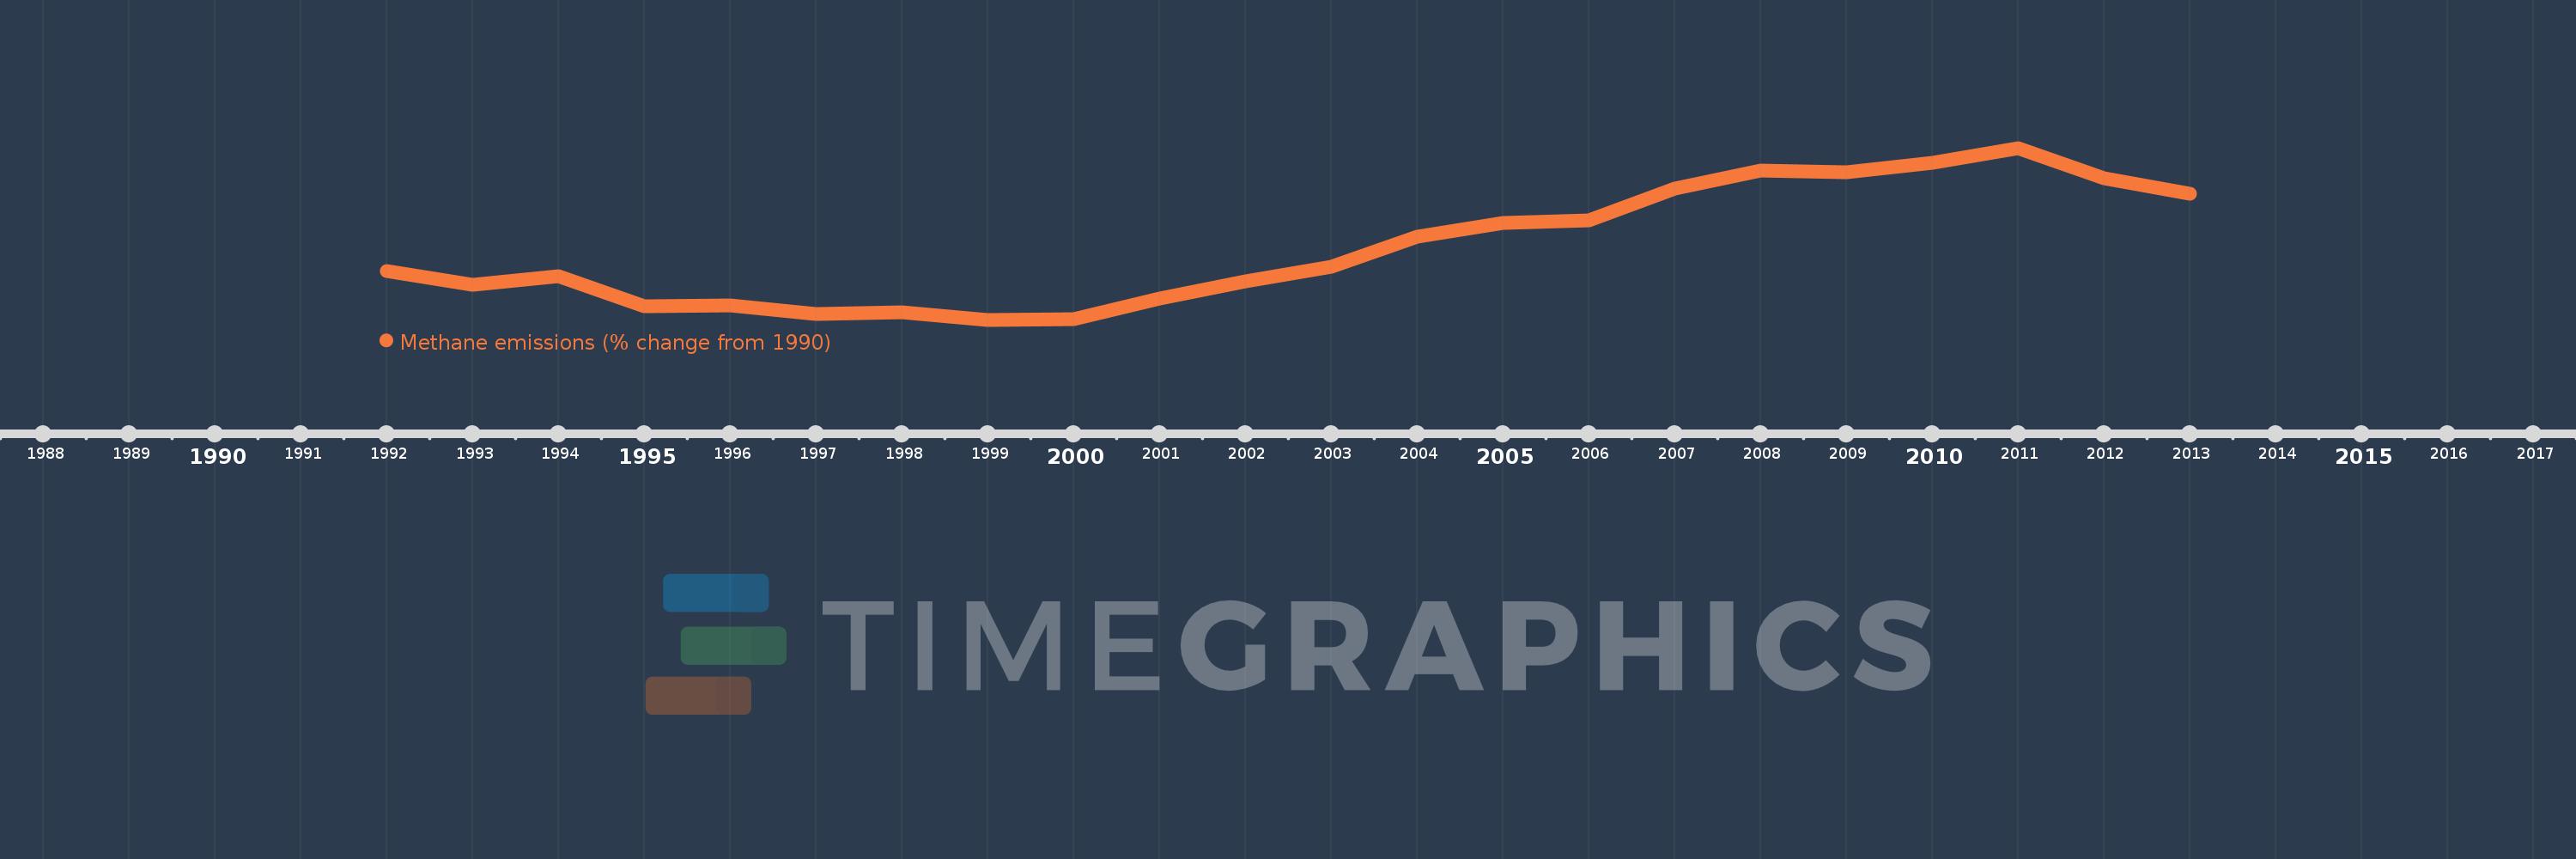
This timeline shows a graph from 1992 to 2013 of Croatia. No data until 1991. Number of actual observations by date: 22.
Source name:
World Development Indicators
Source organization:
World Bank staff estimates from original source: European Commission, Joint Research Centre (JRC)/Netherlands Environmental Assessment Agency (PBL). Emission Database for Global Atmospheric Research (EDGAR): http://edgar.jrc.ec.europa.eu/.
Categories, topics:
Climate Change, Environment
Last updated:
apr 23, 2017
Indicators value changes by year
Meaning:
3.646
Minimum:
-8.793
jan 1, 1999
Maximum:
20.861
jan 1, 2011
At the date of observation
Value
Absolute change
Change from the previous value
jan 1, 1992
-0.38
-0.38
0.0%
jan 1, 1993
-2.806
-2.426
638.53%
jan 1, 1994
-1.307
+1.5
-53.44%
jan 1, 1995
-6.505
-5.198
397.87%
jan 1, 1996
-6.263
+0.242
-3.72%
jan 1, 1997
-7.842
-1.579
25.21%
jan 1, 1998
-7.469
+0.373
-4.76%
jan 1, 1999
-8.793
-1.325
17.73%
jan 1, 2000
-8.747
+0.047
-0.53%
jan 1, 2001
-5.1
+3.647
-41.69%
jan 1, 2002
-2.158
+2.941
-57.68%
jan 1, 2003
0.392
+2.551
-118.18%
jan 1, 2004
5.494
+5.102
1.3K%
jan 1, 2005
7.899
+2.405
43.77%
jan 1, 2006
8.414
+0.515
6.52%
jan 1, 2007
13.817
+5.402
64.2%
jan 1, 2008
16.945
+3.128
22.64%
jan 1, 2009
16.702
-0.243
-1.43%
jan 1, 2010
18.349
+1.647
9.86%
jan 1, 2011
20.861
+2.513
13.69%
jan 1, 2012
15.685
-5.176
-24.81%
jan 1, 2013
13.021
-2.664
-16.98%
Ranking of countries by current statistics by years