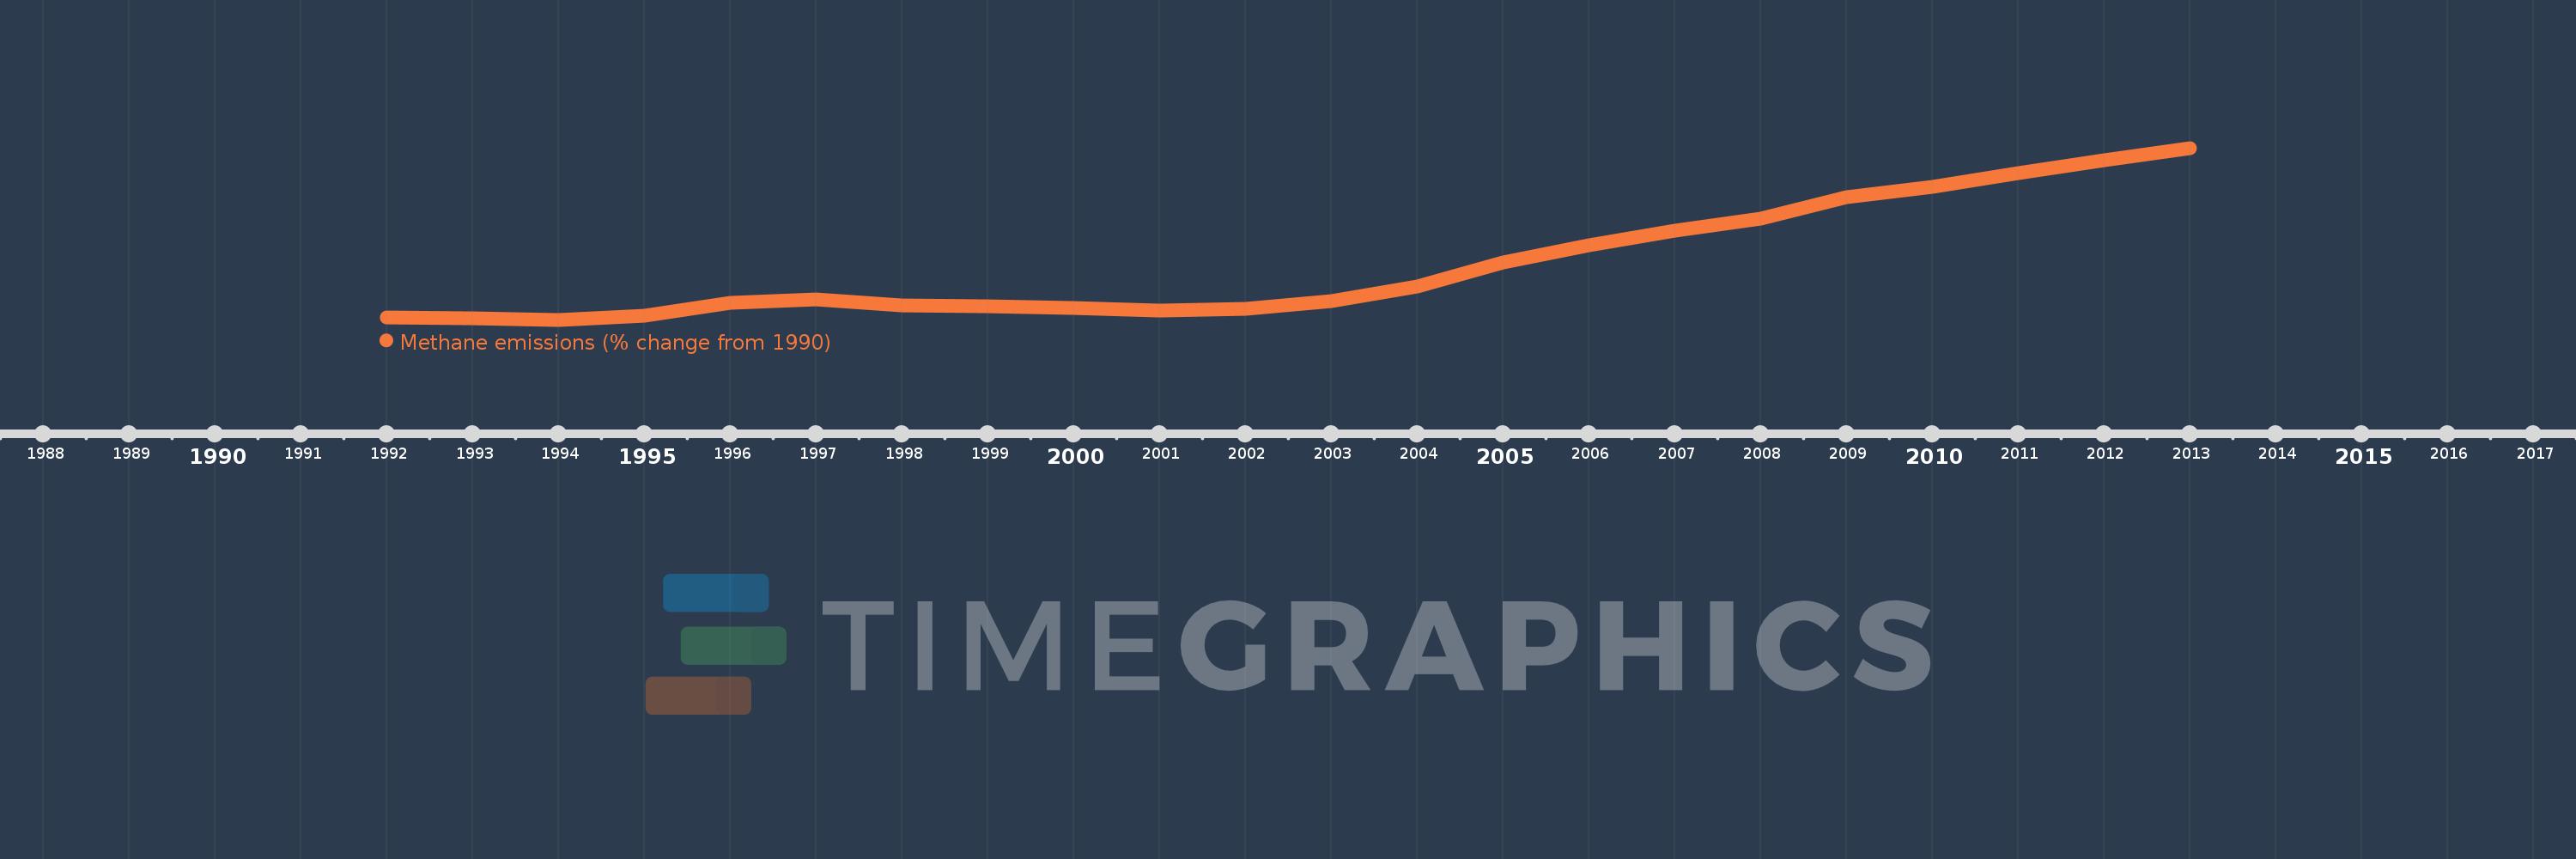
This timeline shows a graph from 1992 to 2013 of China. No data until 1991. Number of actual observations by date: 22.
Source name:
World Development Indicators
Source organization:
World Bank staff estimates from original source: European Commission, Joint Research Centre (JRC)/Netherlands Environmental Assessment Agency (PBL). Emission Database for Global Atmospheric Research (EDGAR): http://edgar.jrc.ec.europa.eu/.
Categories, topics:
Climate Change, Environment
Last updated:
apr 23, 2017
Indicators value changes by year
Meaning:
22.269
Minimum:
-1.37
jan 1, 1994
Maximum:
72.315
jan 1, 2013
At the date of observation
Value
Absolute change
Change from the previous value
jan 1, 1992
-0.333
-0.333
0.0%
jan 1, 1993
-0.647
-0.314
94.1%
jan 1, 1994
-1.37
-0.723
111.7%
jan 1, 1995
0.334
+1.704
-124.41%
jan 1, 1996
5.754
+5.419
1.62K%
jan 1, 1997
7.529
+1.775
30.85%
jan 1, 1998
4.906
-2.623
-34.84%
jan 1, 1999
4.261
-0.645
-13.15%
jan 1, 2000
3.839
-0.422
-9.9%
jan 1, 2001
2.605
-1.234
-32.15%
jan 1, 2002
3.42
+0.815
31.29%
jan 1, 2003
6.773
+3.353
98.04%
jan 1, 2004
12.746
+5.973
88.18%
jan 1, 2005
23.049
+10.303
80.83%
jan 1, 2006
30.571
+7.522
32.63%
jan 1, 2007
36.948
+6.377
20.86%
jan 1, 2008
42.016
+5.067
13.71%
jan 1, 2009
51.166
+9.15
21.78%
jan 1, 2010
55.643
+4.477
8.75%
jan 1, 2011
61.495
+5.852
10.52%
jan 1, 2012
66.905
+5.41
8.8%
jan 1, 2013
72.315
+5.41
8.09%
Ranking of countries by current statistics by years