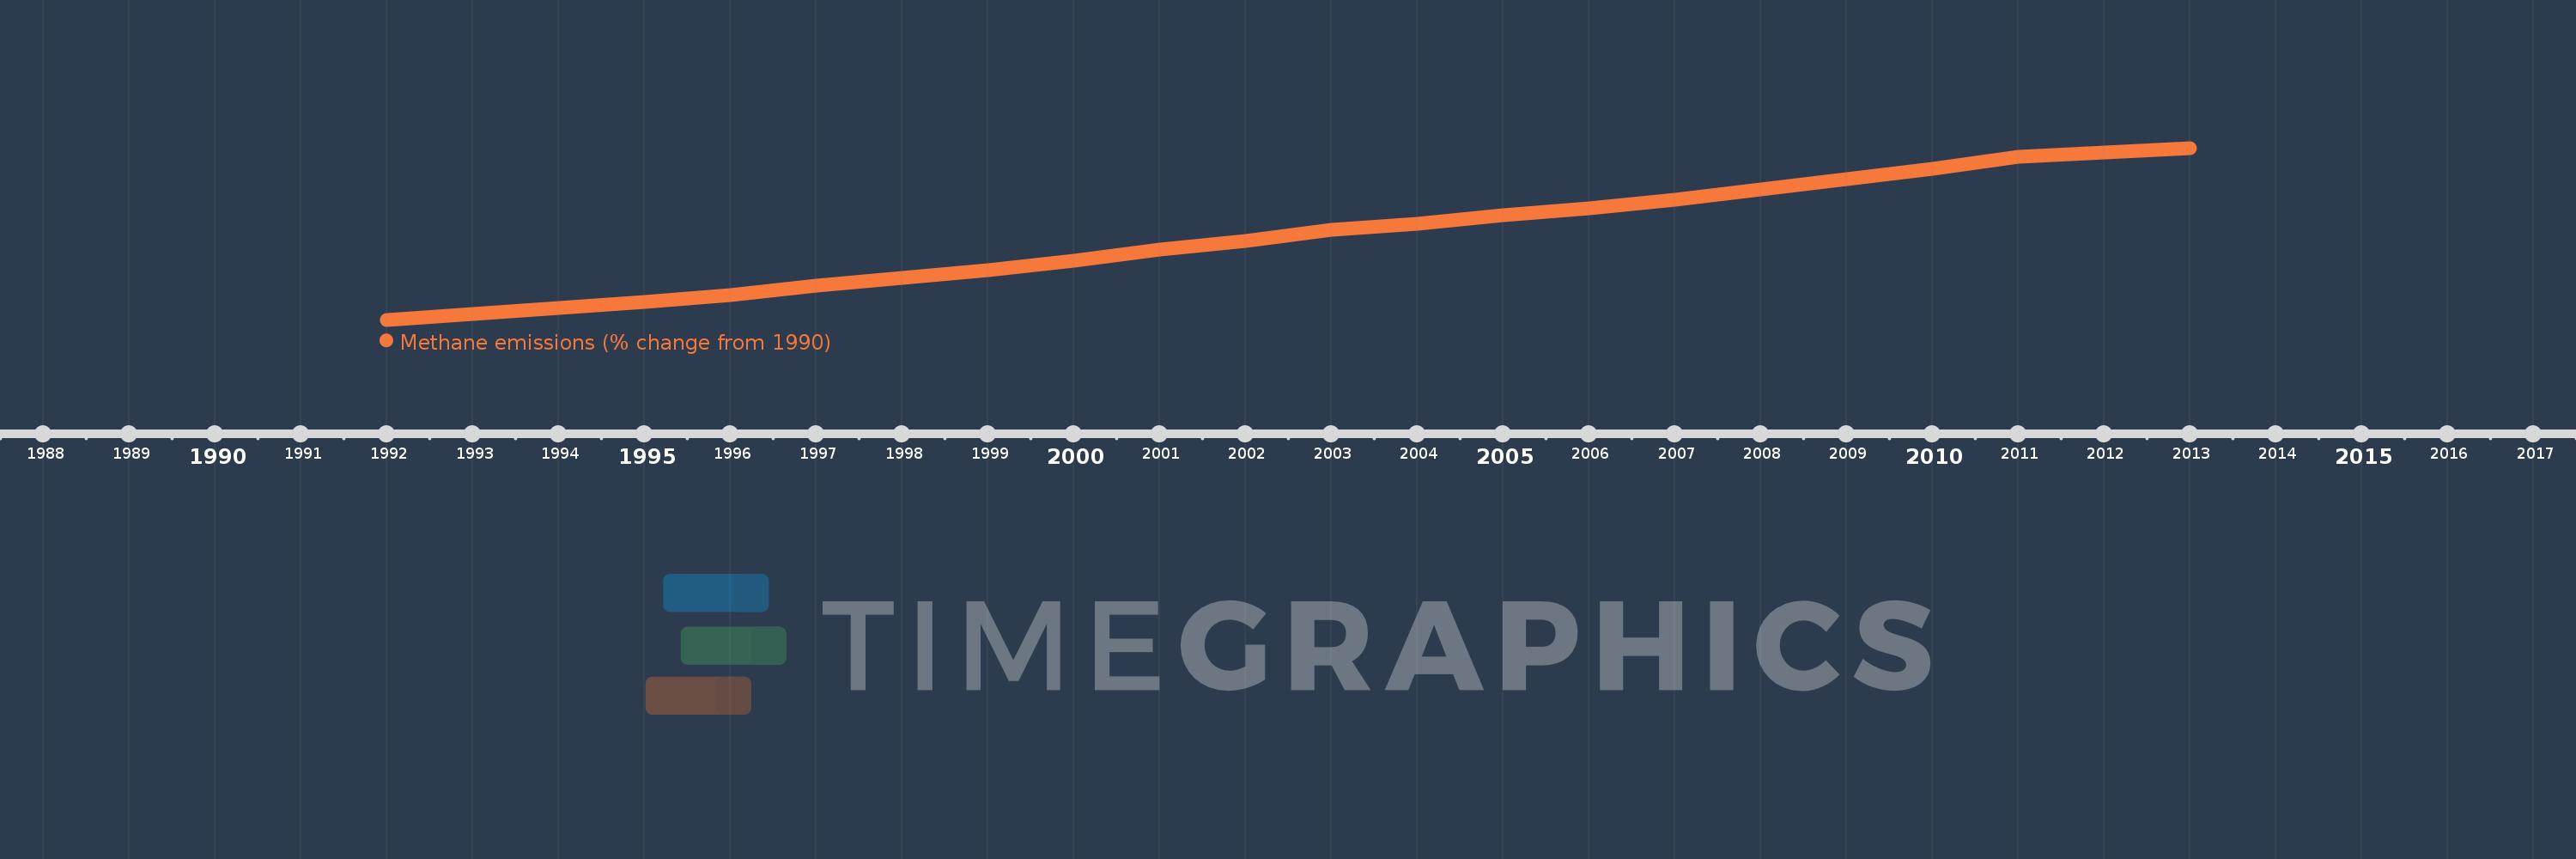
This timeline shows a graph from 1992 to 2013 of Kiribati. No data until 1991. Number of actual observations by date: 22.
Source name:
World Development Indicators
Source organization:
World Bank staff estimates from original source: European Commission, Joint Research Centre (JRC)/Netherlands Environmental Assessment Agency (PBL). Emission Database for Global Atmospheric Research (EDGAR): http://edgar.jrc.ec.europa.eu/.
Categories, topics:
Climate Change, Environment
Last updated:
apr 23, 2017
Indicators value changes by year
Meaning:
30.53
Minimum:
2.02
jan 1, 1992
Maximum:
60.65
jan 1, 2013
At the date of observation
Value
Absolute change
Change from the previous value
jan 1, 1992
2.02
+2.02
0.0%
jan 1, 1993
4.112
+2.092
103.61%
jan 1, 1994
6.066
+1.954
47.51%
jan 1, 1995
8.043
+1.977
32.6%
jan 1, 1996
10.369
+2.326
28.92%
jan 1, 1997
13.615
+3.246
31.31%
jan 1, 1998
16.181
+2.566
18.85%
jan 1, 1999
18.982
+2.801
17.31%
jan 1, 2000
22.197
+3.216
16.94%
jan 1, 2001
25.932
+3.735
16.82%
jan 1, 2002
28.861
+2.929
11.29%
jan 1, 2003
32.643
+3.782
13.1%
jan 1, 2004
34.873
+2.23
6.83%
jan 1, 2005
37.583
+2.709
7.77%
jan 1, 2006
39.928
+2.346
6.24%
jan 1, 2007
42.885
+2.956
7.4%
jan 1, 2008
46.525
+3.64
8.49%
jan 1, 2009
49.985
+3.46
7.44%
jan 1, 2010
53.633
+3.648
7.3%
jan 1, 2011
57.5
+3.868
7.21%
jan 1, 2012
59.075
+1.575
2.74%
jan 1, 2013
60.65
+1.575
2.67%
Ranking of countries by current statistics by years