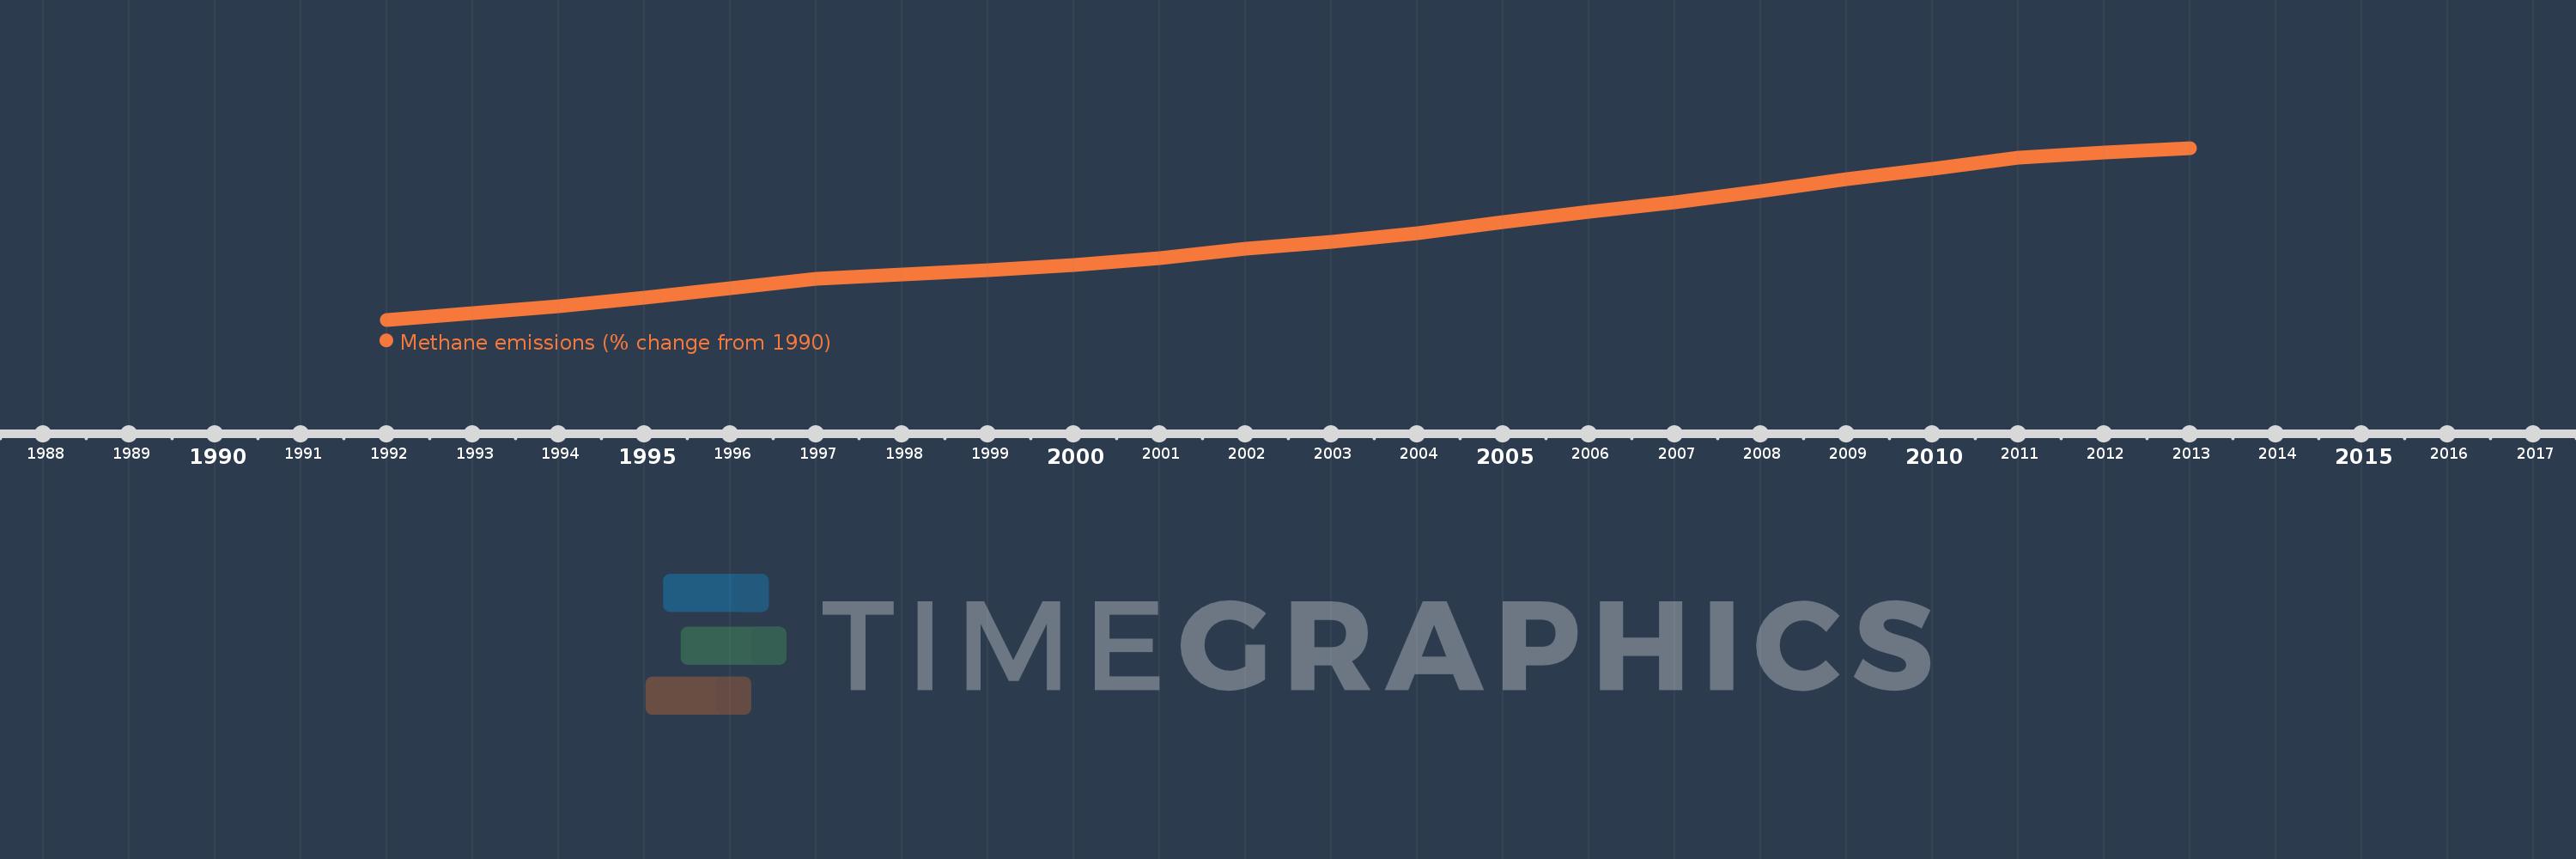
This timeline shows a graph from 1992 to 2013 of Bahamas, The. No data until 1991. Number of actual observations by date: 22.
Source name:
World Development Indicators
Source organization:
World Bank staff estimates from original source: European Commission, Joint Research Centre (JRC)/Netherlands Environmental Assessment Agency (PBL). Emission Database for Global Atmospheric Research (EDGAR): http://edgar.jrc.ec.europa.eu/.
Categories, topics:
Climate Change, Environment
Last updated:
apr 23, 2017
Indicators value changes by year
Meaning:
30.268
Minimum:
2.903
jan 1, 1992
Maximum:
60.204
jan 1, 2013
At the date of observation
Value
Absolute change
Change from the previous value
jan 1, 1992
2.903
+2.903
0.0%
jan 1, 1993
4.97
+2.067
71.2%
jan 1, 1994
7.406
+2.435
49.0%
jan 1, 1995
10.289
+2.884
38.94%
jan 1, 1996
13.284
+2.995
29.11%
jan 1, 1997
16.463
+3.178
23.93%
jan 1, 1998
17.936
+1.473
8.95%
jan 1, 1999
19.377
+1.441
8.03%
jan 1, 2000
21.078
+1.702
8.78%
jan 1, 2001
23.552
+2.473
11.73%
jan 1, 2002
26.654
+3.103
13.17%
jan 1, 2003
28.898
+2.244
8.42%
jan 1, 2004
31.733
+2.835
9.81%
jan 1, 2005
35.561
+3.828
12.06%
jan 1, 2006
38.912
+3.351
9.42%
jan 1, 2007
42.09
+3.178
8.17%
jan 1, 2008
45.782
+3.692
8.77%
jan 1, 2009
49.754
+3.972
8.68%
jan 1, 2010
53.356
+3.602
7.24%
jan 1, 2011
57.063
+3.707
6.95%
jan 1, 2012
58.633
+1.571
2.75%
jan 1, 2013
60.204
+1.571
2.68%
Ranking of countries by current statistics by years