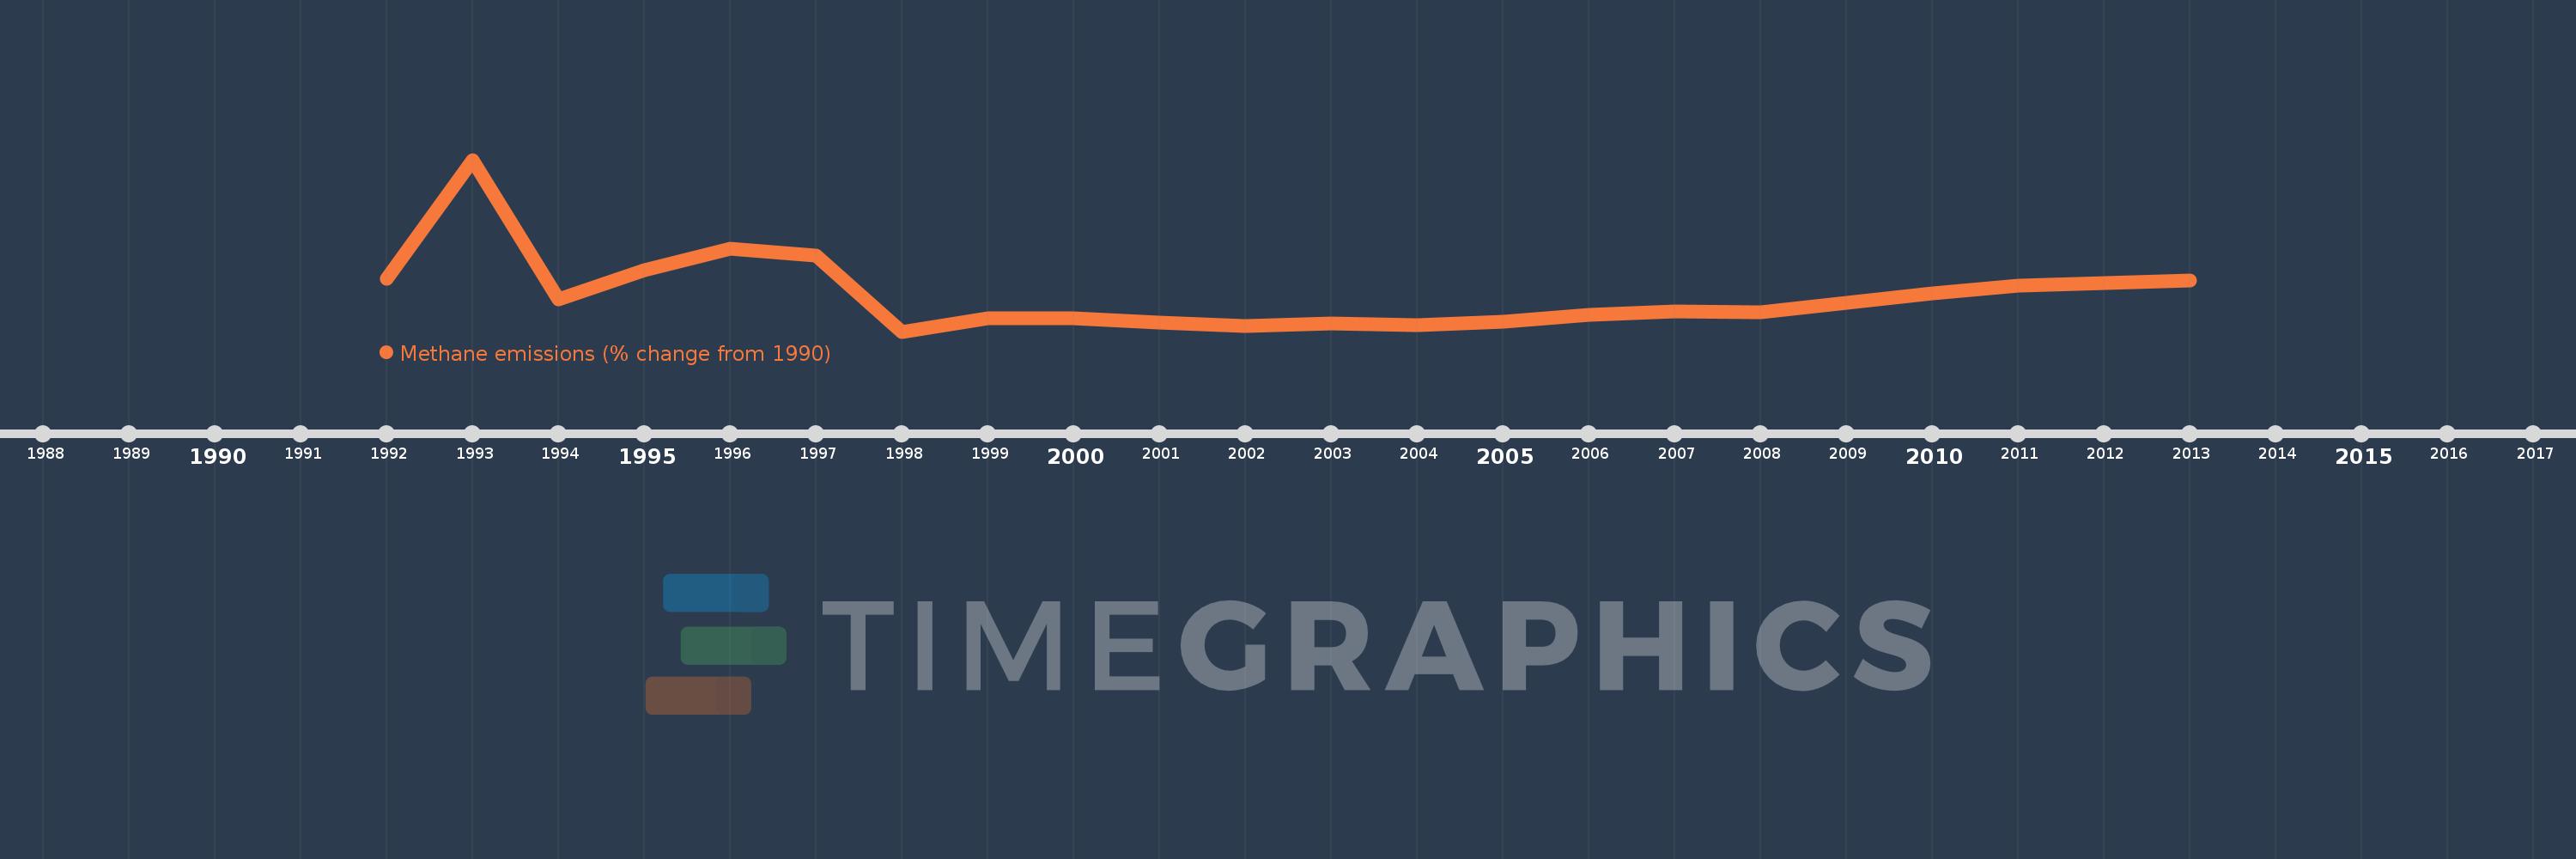
This timeline shows a graph from 1992 to 2013 of Angola. No data until 1991. Number of actual observations by date: 22.
Source name:
World Development Indicators
Source organization:
World Bank staff estimates from original source: European Commission, Joint Research Centre (JRC)/Netherlands Environmental Assessment Agency (PBL). Emission Database for Global Atmospheric Research (EDGAR): http://edgar.jrc.ec.europa.eu/.
Categories, topics:
Climate Change, Environment
Last updated:
apr 23, 2017
Indicators value changes by year
Meaning:
-18.823
Minimum:
-31.671
jan 1, 1998
Maximum:
28.251
jan 1, 1993
At the date of observation
Value
Absolute change
Change from the previous value
jan 1, 1992
-13.098
-13.098
0.0%
jan 1, 1993
28.251
+41.349
-315.68%
jan 1, 1994
-20.443
-48.693
-172.36%
jan 1, 1995
-10.185
+10.258
-50.18%
jan 1, 1996
-2.883
+7.302
-71.69%
jan 1, 1997
-5.23
-2.347
81.4%
jan 1, 1998
-31.671
-26.441
505.58%
jan 1, 1999
-27.064
+4.606
-14.54%
jan 1, 2000
-27.042
+0.023
-0.08%
jan 1, 2001
-28.555
-1.513
5.59%
jan 1, 2002
-29.74
-1.185
4.15%
jan 1, 2003
-28.842
+0.897
-3.02%
jan 1, 2004
-29.318
-0.476
1.65%
jan 1, 2005
-28.325
+0.994
-3.39%
jan 1, 2006
-25.833
+2.492
-8.8%
jan 1, 2007
-24.722
+1.111
-4.3%
jan 1, 2008
-24.961
-0.239
0.97%
jan 1, 2009
-21.598
+3.362
-13.47%
jan 1, 2010
-18.401
+3.198
-14.81%
jan 1, 2011
-15.66
+2.741
-14.89%
jan 1, 2012
-14.816
+0.843
-5.39%
jan 1, 2013
-13.973
+0.843
-5.69%
Ranking of countries by current statistics by years