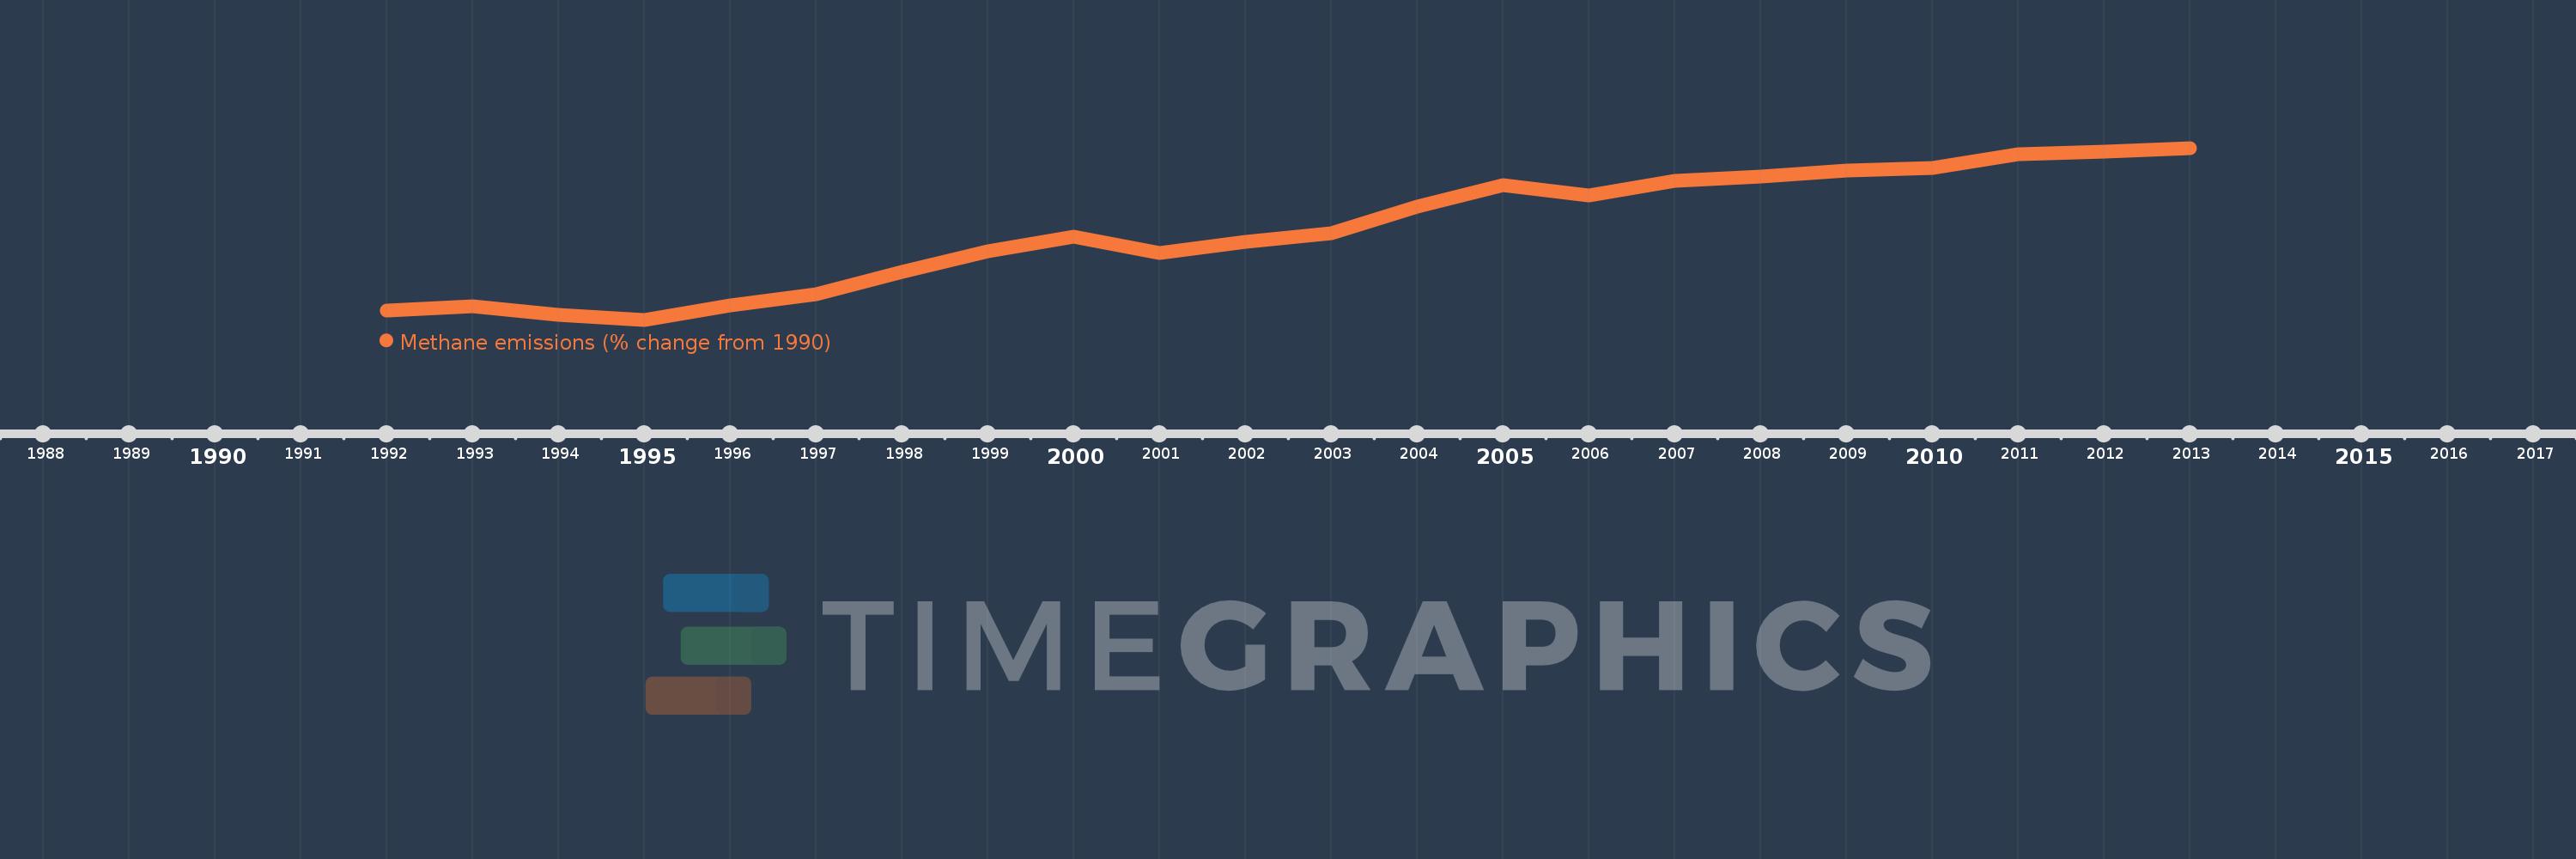
This timeline shows a graph from 1992 to 2013 of Rwanda. No data until 1991. Number of actual observations by date: 22.
Source name:
World Development Indicators
Source organization:
World Bank staff estimates from original source: European Commission, Joint Research Centre (JRC)/Netherlands Environmental Assessment Agency (PBL). Emission Database for Global Atmospheric Research (EDGAR): http://edgar.jrc.ec.europa.eu/.
Categories, topics:
Climate Change, Environment
Last updated:
apr 23, 2017
Indicators value changes by year
Meaning:
49.077
Minimum:
-3.683
jan 1, 1995
Maximum:
98.151
jan 1, 2013
At the date of observation
Value
Absolute change
Change from the previous value
jan 1, 1992
1.77
+1.77
0.0%
jan 1, 1993
4.108
+2.337
132.04%
jan 1, 1994
-0.809
-4.917
-119.69%
jan 1, 1995
-3.683
-2.874
355.29%
jan 1, 1996
4.58
+8.263
-224.34%
jan 1, 1997
11.532
+6.952
151.79%
jan 1, 1998
24.51
+12.978
112.54%
jan 1, 1999
36.796
+12.286
50.13%
jan 1, 2000
45.627
+8.831
24.0%
jan 1, 2001
35.799
-9.828
-21.54%
jan 1, 2002
42.631
+6.832
19.08%
jan 1, 2003
47.689
+5.058
11.87%
jan 1, 2004
63.155
+15.466
32.43%
jan 1, 2005
76.358
+13.203
20.91%
jan 1, 2006
69.765
-6.593
-8.63%
jan 1, 2007
78.683
+8.918
12.78%
jan 1, 2008
81.404
+2.721
3.46%
jan 1, 2009
84.646
+3.242
3.98%
jan 1, 2010
86.512
+1.866
2.2%
jan 1, 2011
94.266
+7.754
8.96%
jan 1, 2012
96.209
+1.943
2.06%
jan 1, 2013
98.151
+1.943
2.02%
Ranking of countries by current statistics by years