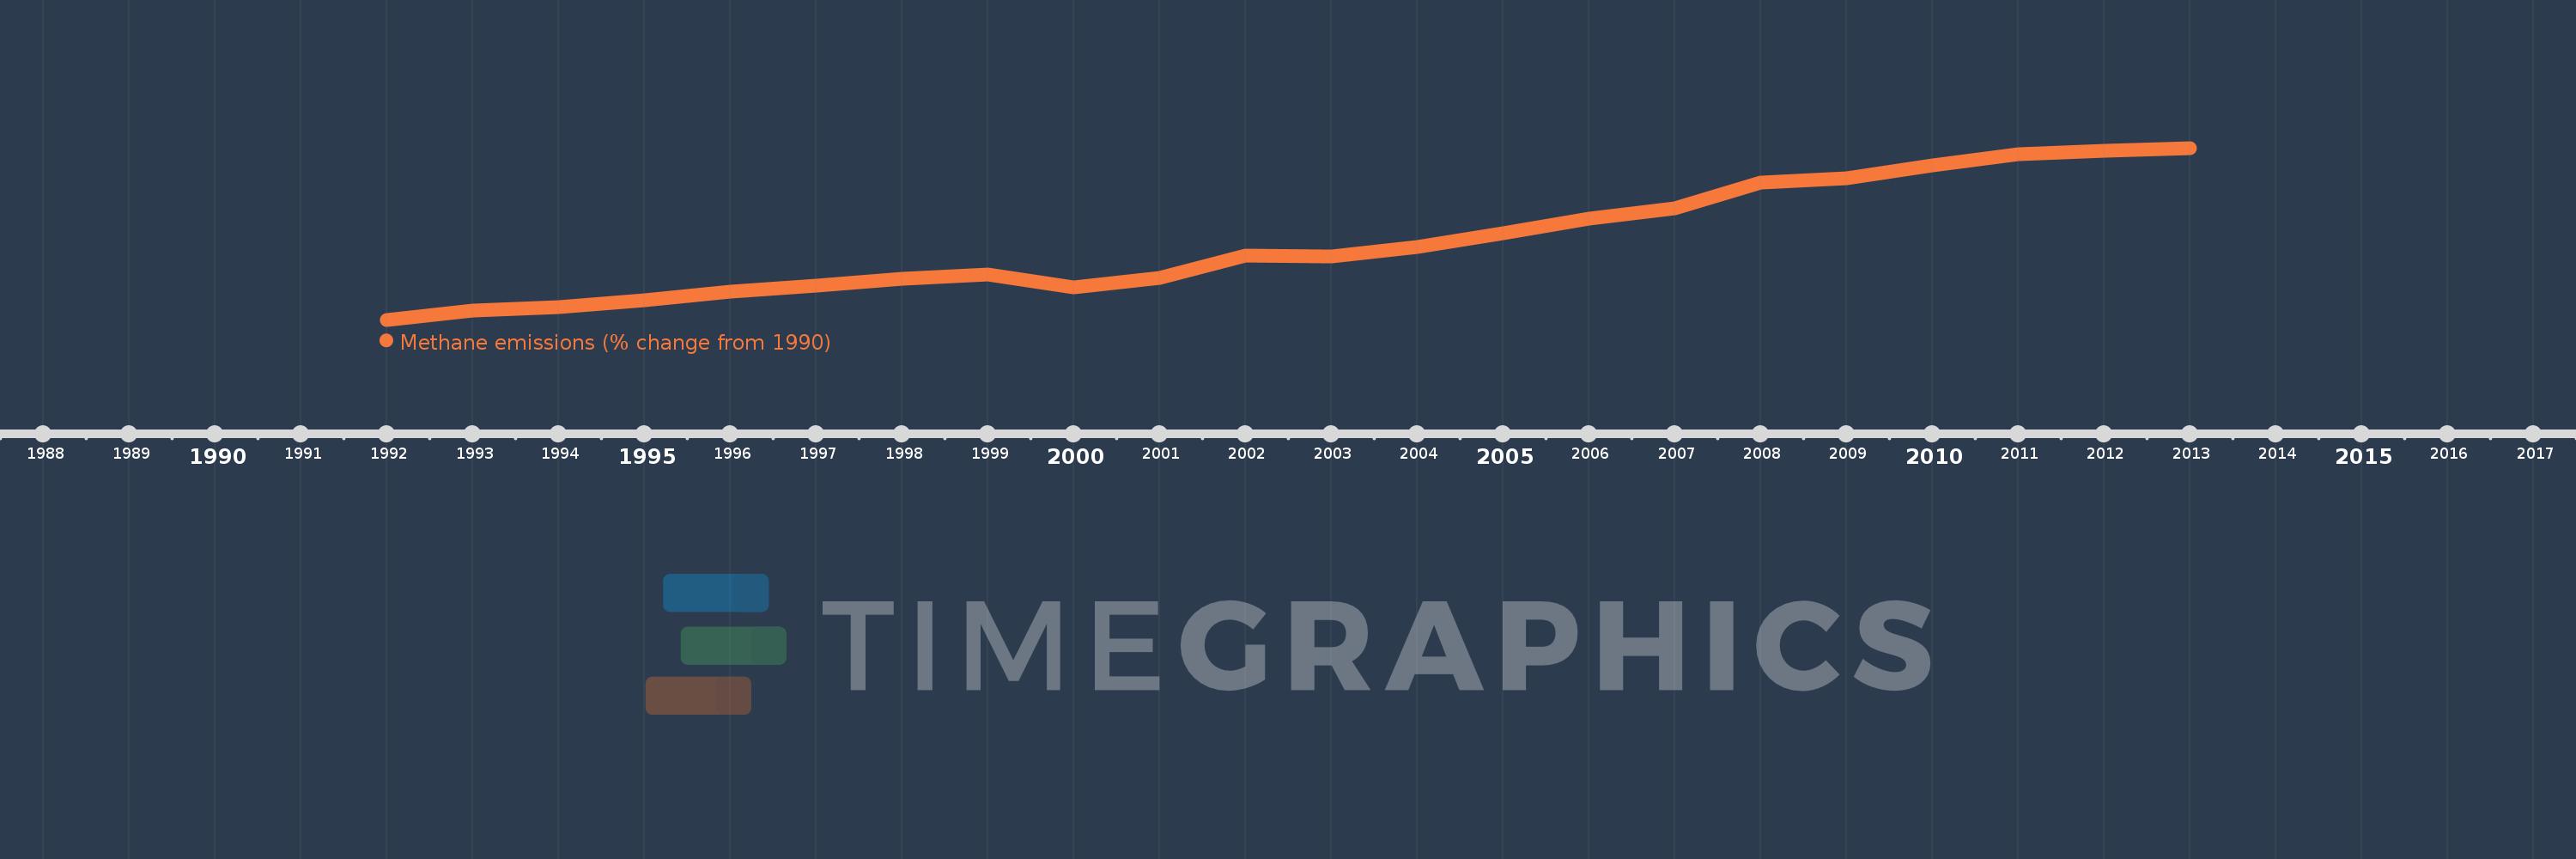
This timeline shows a graph from 1992 to 2013 of Burkina Faso. No data until 1991. Number of actual observations by date: 22.
Source name:
World Development Indicators
Source organization:
World Bank staff estimates from original source: European Commission, Joint Research Centre (JRC)/Netherlands Environmental Assessment Agency (PBL). Emission Database for Global Atmospheric Research (EDGAR): http://edgar.jrc.ec.europa.eu/.
Categories, topics:
Climate Change, Environment
Last updated:
apr 23, 2017
Indicators value changes by year
Meaning:
47.298
Minimum:
-1.341
jan 1, 1992
Maximum:
106.643
jan 1, 2013
At the date of observation
Value
Absolute change
Change from the previous value
jan 1, 1992
-1.341
-1.341
0.0%
jan 1, 1993
4.692
+6.033
-449.89%
jan 1, 1994
6.8
+2.108
44.93%
jan 1, 1995
10.654
+3.854
56.68%
jan 1, 1996
16.495
+5.841
54.82%
jan 1, 1997
19.922
+3.428
20.78%
jan 1, 1998
24.424
+4.502
22.6%
jan 1, 1999
27.248
+2.824
11.56%
jan 1, 2000
19.2
-8.047
-29.53%
jan 1, 2001
24.89
+5.69
29.63%
jan 1, 2002
38.76
+13.871
55.73%
jan 1, 2003
38.59
-0.17
-0.44%
jan 1, 2004
44.421
+5.83
15.11%
jan 1, 2005
52.797
+8.376
18.86%
jan 1, 2006
62.282
+9.484
17.96%
jan 1, 2007
68.948
+6.666
10.7%
jan 1, 2008
85.077
+16.13
23.39%
jan 1, 2009
87.396
+2.318
2.72%
jan 1, 2010
95.453
+8.057
9.22%
jan 1, 2011
102.592
+7.139
7.48%
jan 1, 2012
104.617
+2.026
1.97%
jan 1, 2013
106.643
+2.026
1.94%
Ranking of countries by current statistics by years