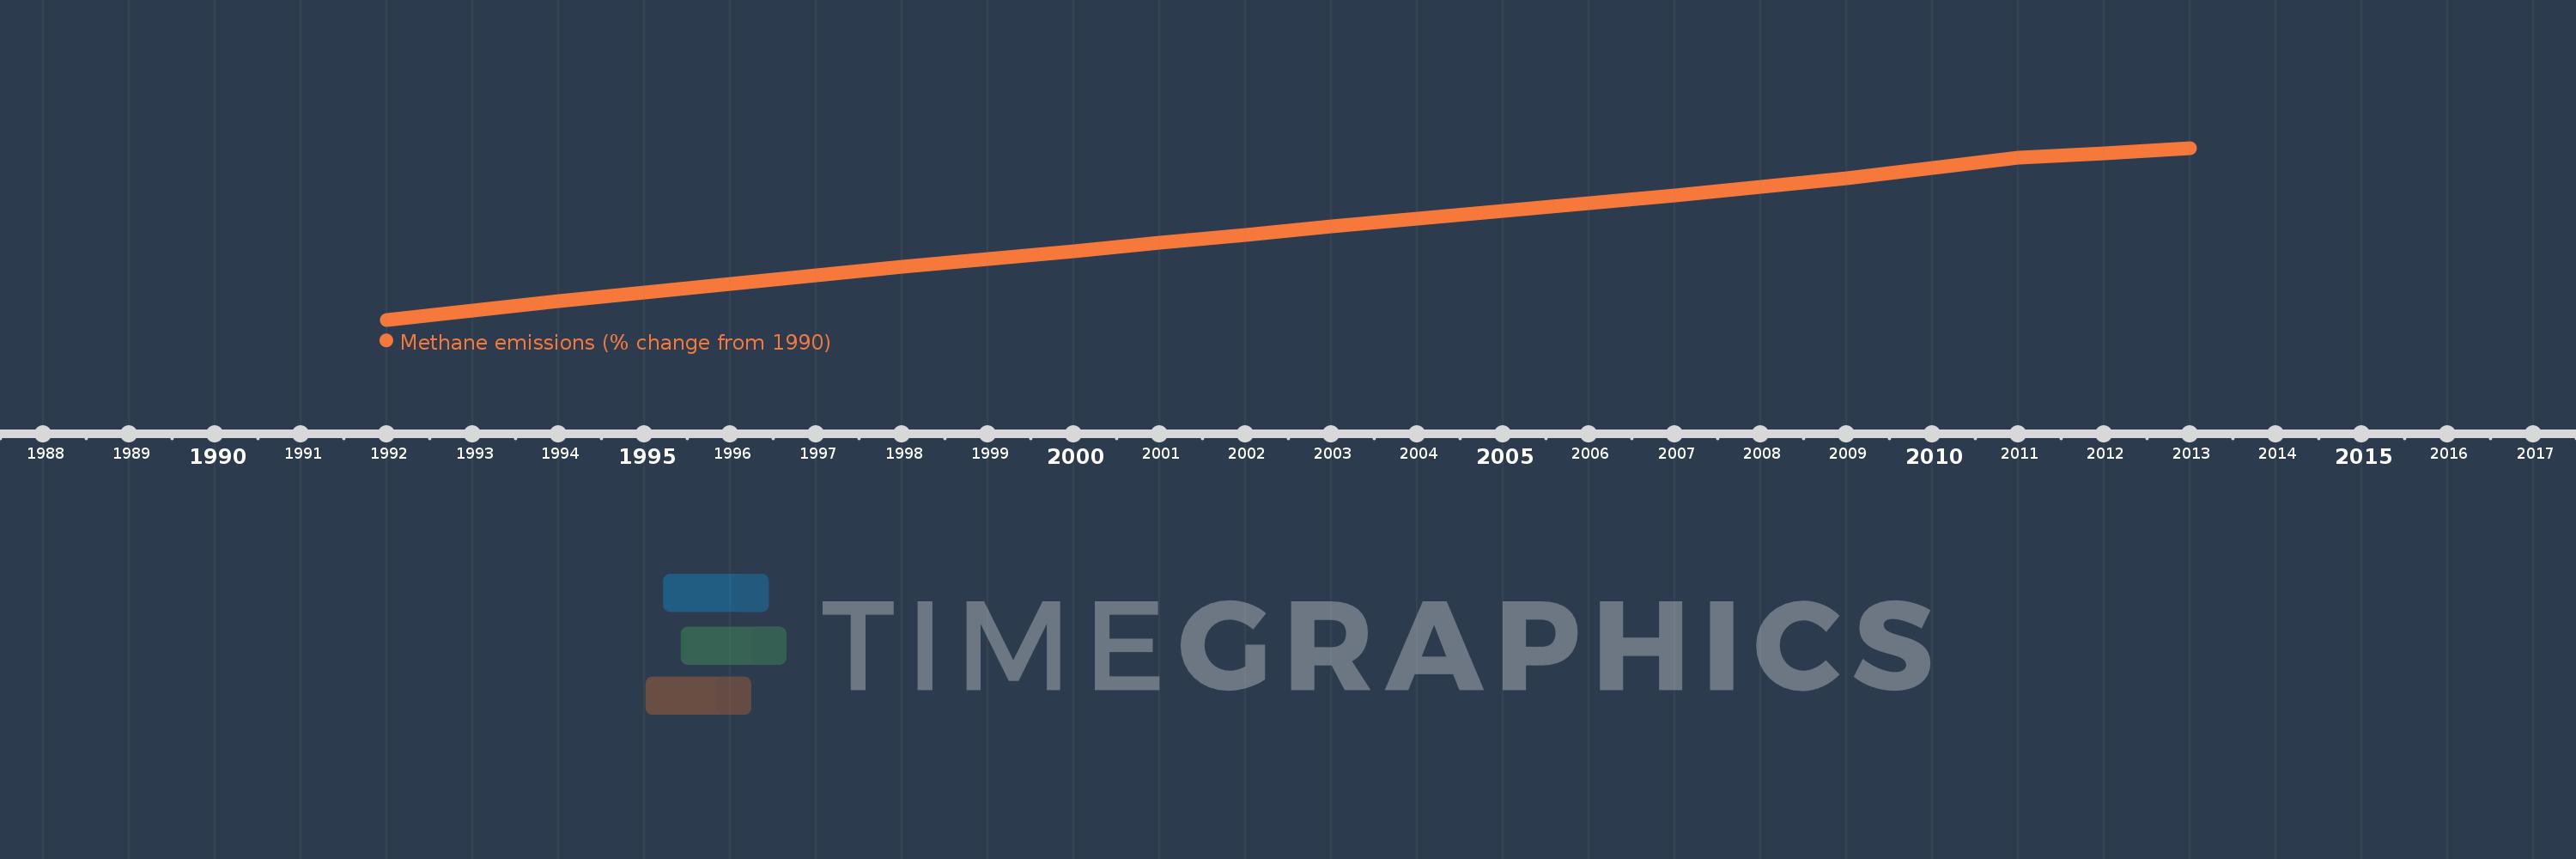
This timeline shows a graph from 1992 to 2013 of Guam. No data until 1991. Number of actual observations by date: 22.
Source name:
World Development Indicators
Source organization:
World Bank staff estimates from original source: European Commission, Joint Research Centre (JRC)/Netherlands Environmental Assessment Agency (PBL). Emission Database for Global Atmospheric Research (EDGAR): http://edgar.jrc.ec.europa.eu/.
Categories, topics:
Climate Change, Environment
Last updated:
apr 23, 2017
Indicators value changes by year
Meaning:
28.982
Minimum:
2.598
jan 1, 1992
Maximum:
53.776
jan 1, 2013
At the date of observation
Value
Absolute change
Change from the previous value
jan 1, 1992
2.598
+2.598
0.0%
jan 1, 1993
5.306
+2.708
104.21%
jan 1, 1994
8.041
+2.735
51.54%
jan 1, 1995
10.728
+2.688
33.43%
jan 1, 1996
13.335
+2.606
24.29%
jan 1, 1997
15.835
+2.5
18.75%
jan 1, 1998
18.346
+2.511
15.86%
jan 1, 1999
20.599
+2.252
12.28%
jan 1, 2000
23.017
+2.419
11.74%
jan 1, 2001
25.446
+2.429
10.55%
jan 1, 2002
27.89
+2.444
9.6%
jan 1, 2003
30.356
+2.466
8.84%
jan 1, 2004
32.662
+2.306
7.6%
jan 1, 2005
34.992
+2.33
7.13%
jan 1, 2006
37.297
+2.305
6.59%
jan 1, 2007
39.628
+2.331
6.25%
jan 1, 2008
42.142
+2.514
6.34%
jan 1, 2009
44.871
+2.729
6.48%
jan 1, 2010
47.718
+2.847
6.34%
jan 1, 2011
50.761
+3.043
6.38%
jan 1, 2012
52.268
+1.508
2.97%
jan 1, 2013
53.776
+1.508
2.88%
Ranking of countries by current statistics by years