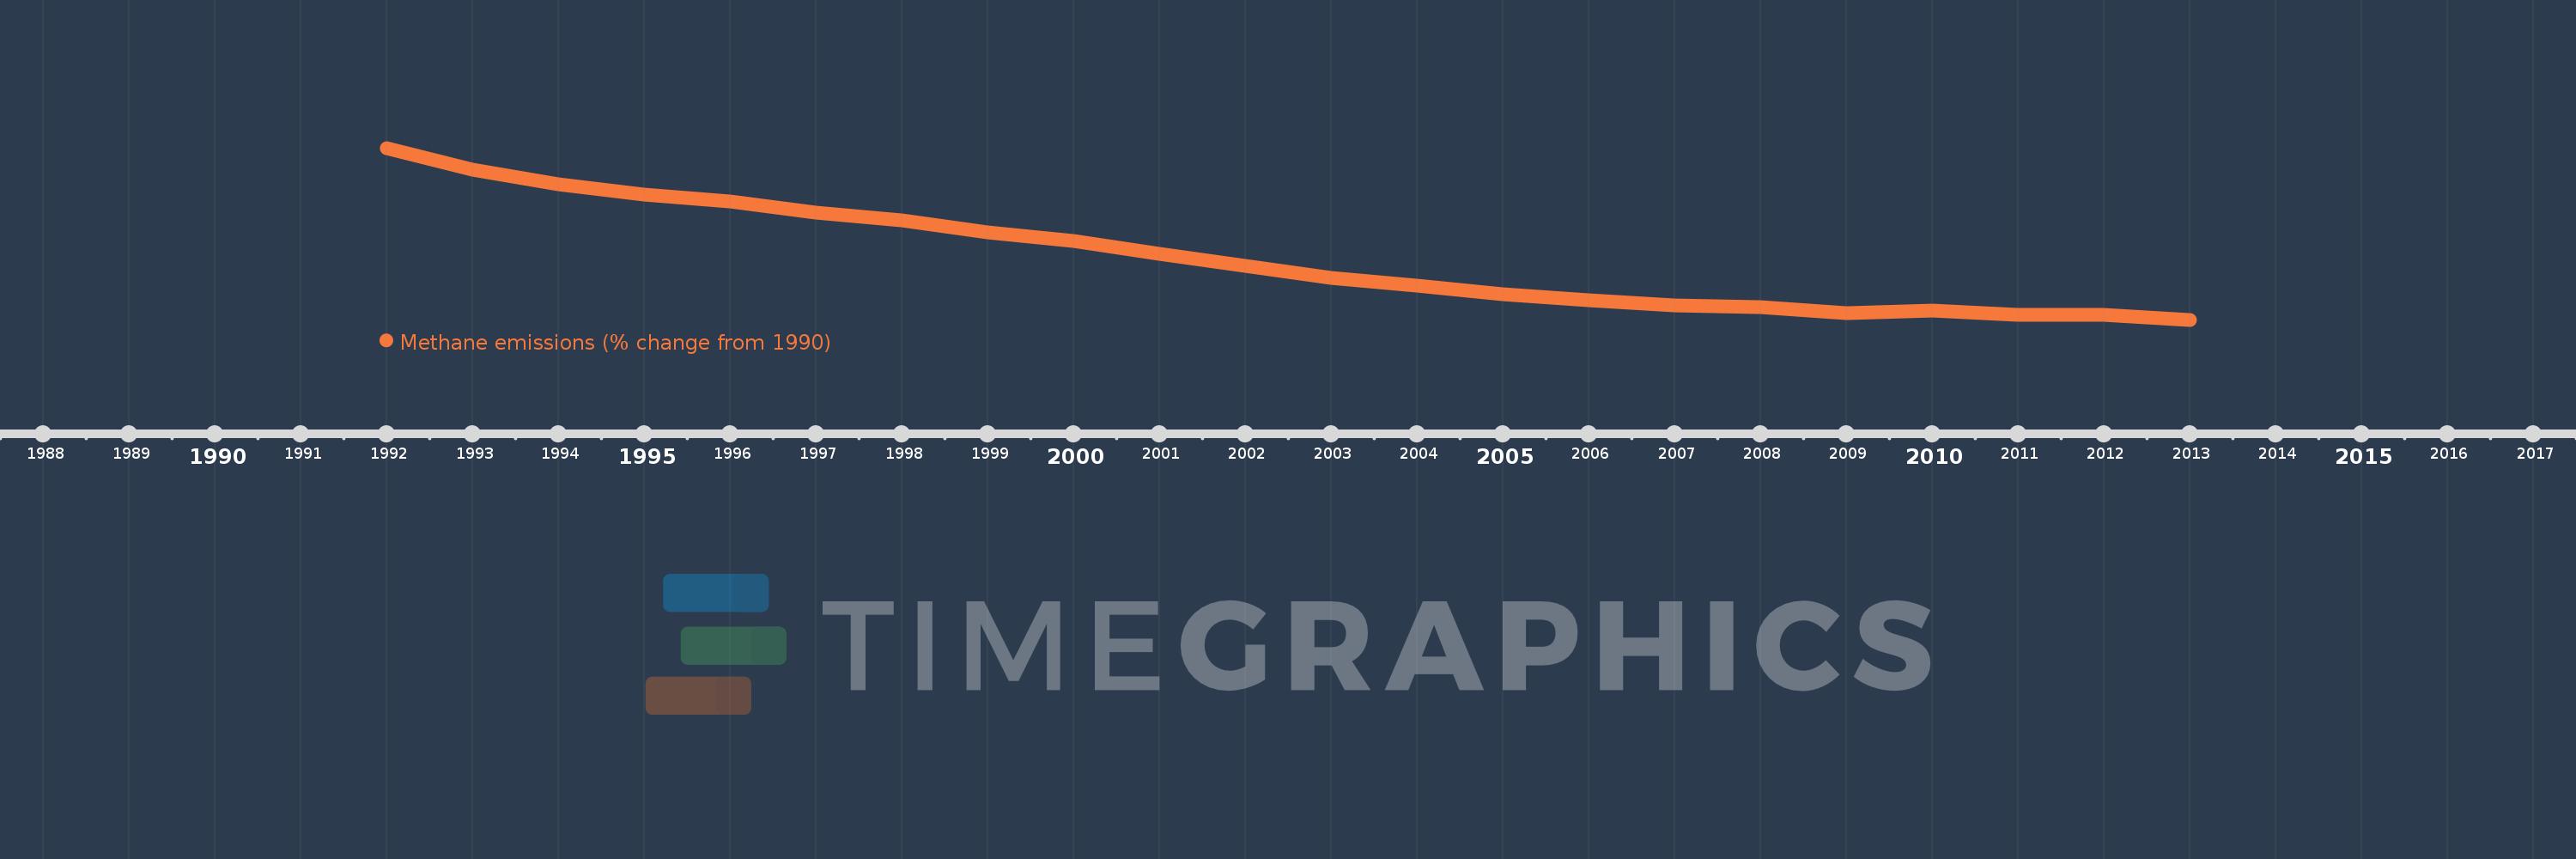
This timeline shows a graph from 1992 to 2013 of Germany. No data until 1991. Number of actual observations by date: 22.
Source name:
World Development Indicators
Source organization:
World Bank staff estimates from original source: European Commission, Joint Research Centre (JRC)/Netherlands Environmental Assessment Agency (PBL). Emission Database for Global Atmospheric Research (EDGAR): http://edgar.jrc.ec.europa.eu/.
Categories, topics:
Climate Change, Environment
Last updated:
apr 23, 2017
Indicators value changes by year
Meaning:
-35.014
Minimum:
-51.751
jan 1, 2013
Maximum:
-5.473
jan 1, 1992
At the date of observation
Value
Absolute change
Change from the previous value
jan 1, 1992
-5.473
-5.473
0.0%
jan 1, 1993
-11.244
-5.77
105.43%
jan 1, 1994
-15.258
-4.015
35.7%
jan 1, 1995
-18.143
-2.885
18.91%
jan 1, 1996
-19.845
-1.702
9.38%
jan 1, 1997
-22.876
-3.031
15.28%
jan 1, 1998
-24.871
-1.994
8.72%
jan 1, 1999
-28.112
-3.242
13.03%
jan 1, 2000
-30.584
-2.472
8.79%
jan 1, 2001
-34.011
-3.427
11.2%
jan 1, 2002
-37.207
-3.196
9.4%
jan 1, 2003
-40.449
-3.242
8.71%
jan 1, 2004
-42.576
-2.127
5.26%
jan 1, 2005
-44.825
-2.249
5.28%
jan 1, 2006
-46.518
-1.693
3.78%
jan 1, 2007
-47.99
-1.472
3.16%
jan 1, 2008
-48.397
-0.406
0.85%
jan 1, 2009
-50.064
-1.667
3.45%
jan 1, 2010
-49.198
+0.866
-1.73%
jan 1, 2011
-50.444
-1.247
2.53%
jan 1, 2012
-50.459
-0.015
0.03%
jan 1, 2013
-51.751
-1.292
2.56%
Ranking of countries by current statistics by years