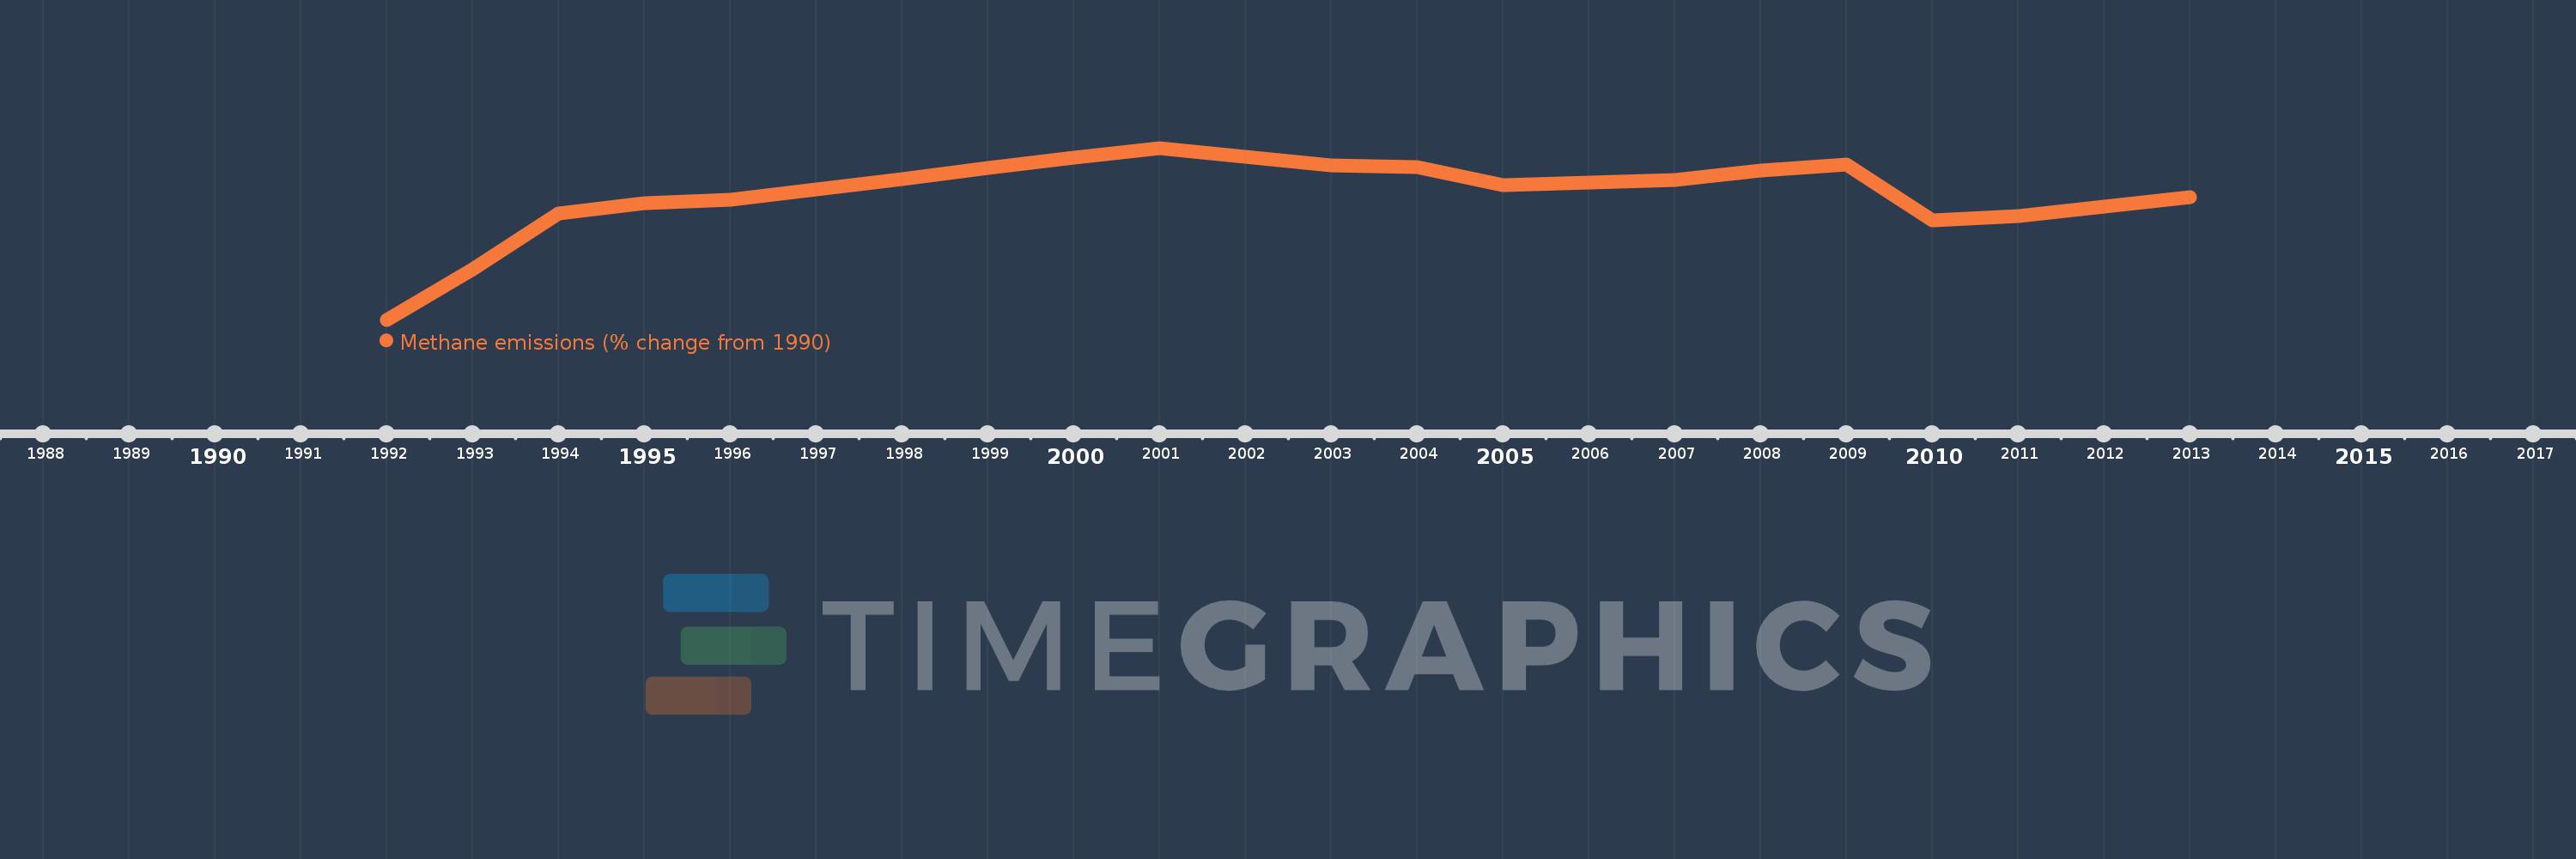
This timeline shows a graph from 1992 to 2013 of Vanuatu. No data until 1991. Number of actual observations by date: 22.
Source name:
World Development Indicators
Source organization:
World Bank staff estimates from original source: European Commission, Joint Research Centre (JRC)/Netherlands Environmental Assessment Agency (PBL). Emission Database for Global Atmospheric Research (EDGAR): http://edgar.jrc.ec.europa.eu/.
Categories, topics:
Climate Change, Environment
Last updated:
apr 23, 2017
Indicators value changes by year
Meaning:
19.205
Minimum:
3.482
jan 1, 1992
Maximum:
24.898
jan 1, 2001
At the date of observation
Value
Absolute change
Change from the previous value
jan 1, 1992
3.482
+3.482
0.0%
jan 1, 1993
9.747
+6.265
179.92%
jan 1, 1994
16.677
+6.93
71.1%
jan 1, 1995
18.012
+1.335
8.01%
jan 1, 1996
18.417
+0.405
2.25%
jan 1, 1997
19.767
+1.351
7.33%
jan 1, 1998
21.01
+1.243
6.29%
jan 1, 1999
22.358
+1.348
6.41%
jan 1, 2000
23.702
+1.344
6.01%
jan 1, 2001
24.898
+1.195
5.04%
jan 1, 2002
23.785
-1.112
-4.47%
jan 1, 2003
22.772
-1.013
-4.26%
jan 1, 2004
22.508
-0.264
-1.16%
jan 1, 2005
20.302
-2.207
-9.8%
jan 1, 2006
20.531
+0.23
1.13%
jan 1, 2007
20.957
+0.425
2.07%
jan 1, 2008
22.055
+1.099
5.24%
jan 1, 2009
22.871
+0.816
3.7%
jan 1, 2010
15.838
-7.034
-30.75%
jan 1, 2011
16.443
+0.606
3.82%
jan 1, 2012
17.608
+1.164
7.08%
jan 1, 2013
18.772
+1.164
6.61%
Ranking of countries by current statistics by years