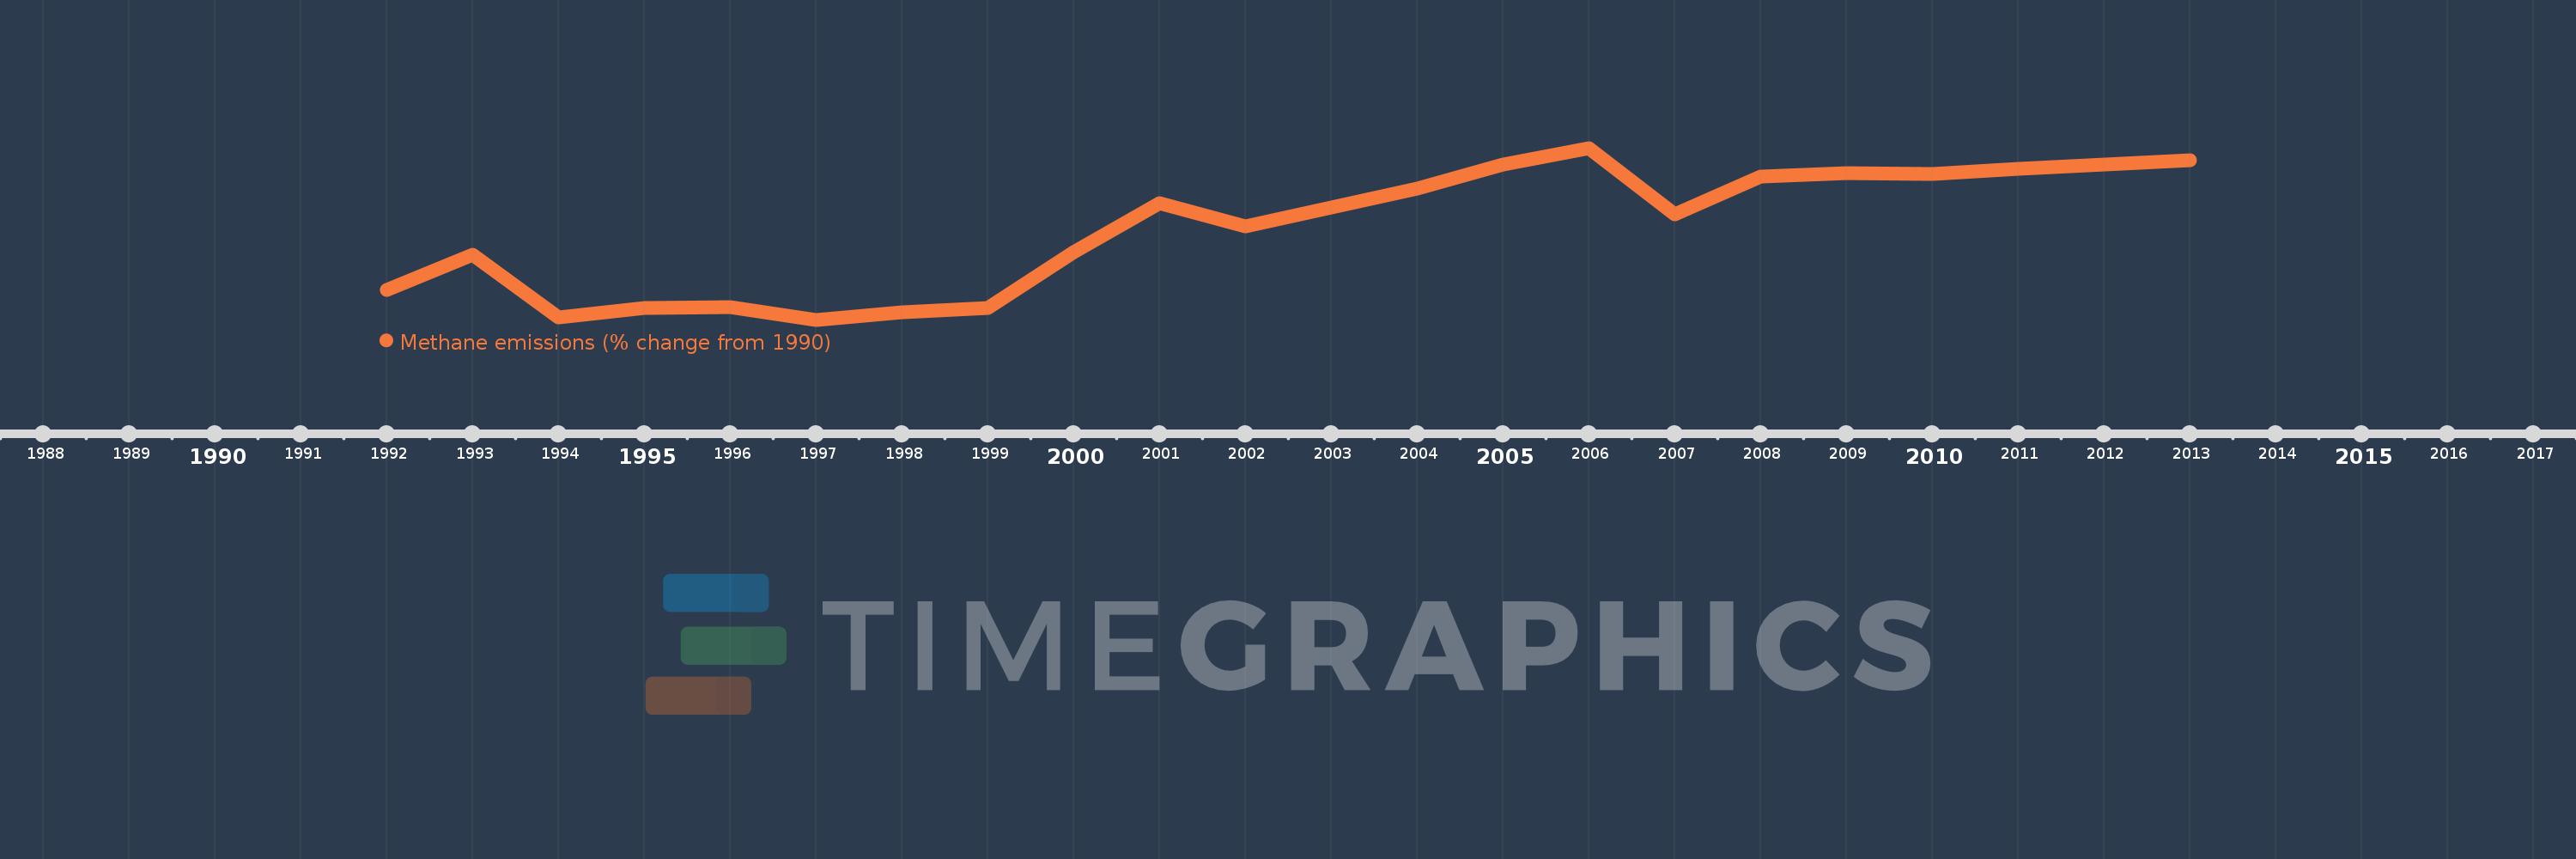
This timeline shows a graph from 1992 to 2013 of Namibia. No data until 1991. Number of actual observations by date: 22.
Source name:
World Development Indicators
Source organization:
World Bank staff estimates from original source: European Commission, Joint Research Centre (JRC)/Netherlands Environmental Assessment Agency (PBL). Emission Database for Global Atmospheric Research (EDGAR): http://edgar.jrc.ec.europa.eu/.
Categories, topics:
Climate Change, Environment
Last updated:
apr 23, 2017
Indicators value changes by year
Meaning:
19.939
Minimum:
-11.214
jan 1, 1997
Maximum:
47.779
jan 1, 2006
At the date of observation
Value
Absolute change
Change from the previous value
jan 1, 1992
-1.051
-1.051
0.0%
jan 1, 1993
11.258
+12.31
-1.17K%
jan 1, 1994
-10.421
-21.679
-192.56%
jan 1, 1995
-7.162
+3.259
-31.28%
jan 1, 1996
-6.854
+0.308
-4.29%
jan 1, 1997
-11.214
-4.36
63.61%
jan 1, 1998
-8.747
+2.467
-22.0%
jan 1, 1999
-7.215
+1.531
-17.51%
jan 1, 2000
12.073
+19.288
-267.33%
jan 1, 2001
28.935
+16.862
139.66%
jan 1, 2002
20.917
-8.018
-27.71%
jan 1, 2003
27.257
+6.341
30.32%
jan 1, 2004
33.788
+6.531
23.96%
jan 1, 2005
42.148
+8.36
24.74%
jan 1, 2006
47.779
+5.631
13.36%
jan 1, 2007
24.977
-22.802
-47.72%
jan 1, 2008
38.095
+13.118
52.52%
jan 1, 2009
39.075
+0.98
2.57%
jan 1, 2010
38.89
-0.185
-0.47%
jan 1, 2011
40.639
+1.749
4.5%
jan 1, 2012
42.045
+1.406
3.46%
jan 1, 2013
43.452
+1.406
3.34%
Ranking of countries by current statistics by years