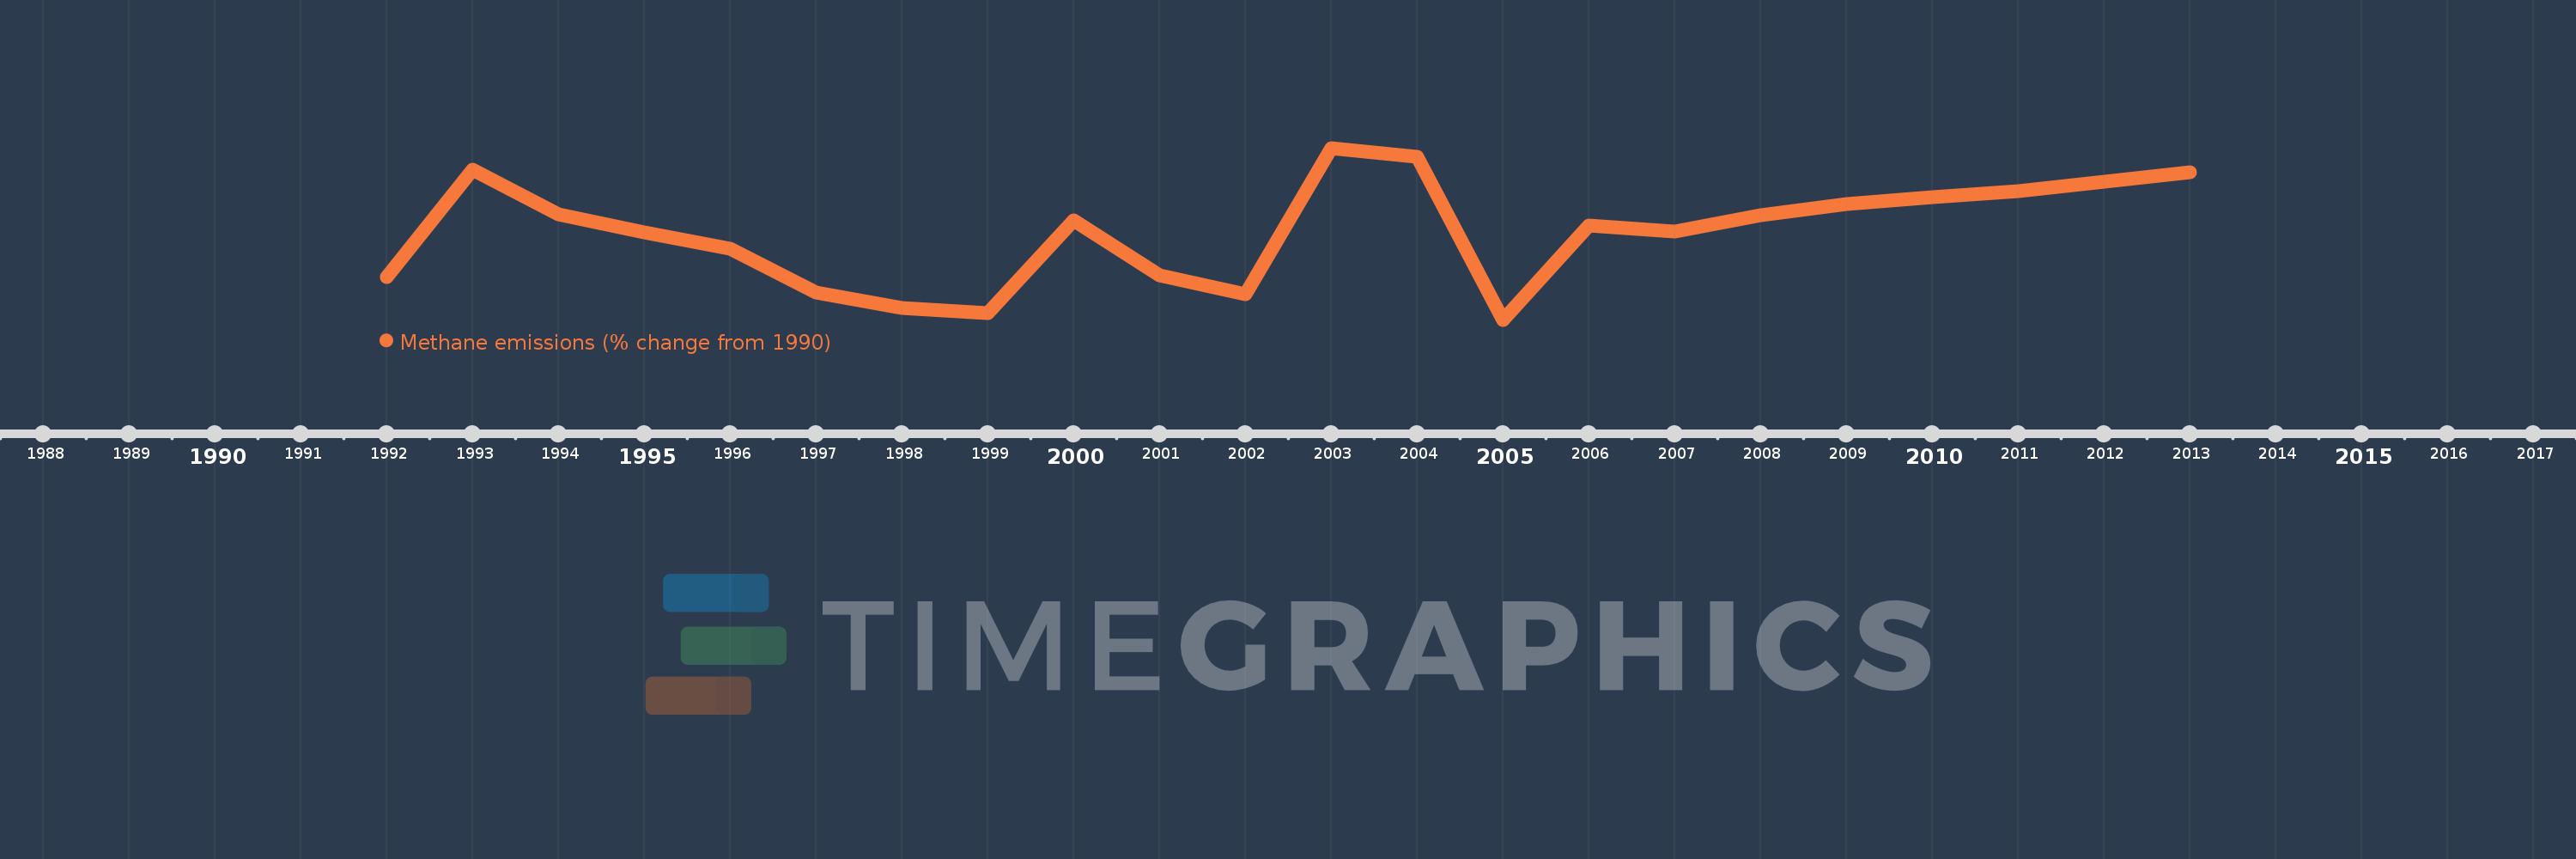
This timeline shows a graph from 1992 to 2013 of Lesotho. No data until 1991. Number of actual observations by date: 22.
Source name:
World Development Indicators
Source organization:
World Bank staff estimates from original source: European Commission, Joint Research Centre (JRC)/Netherlands Environmental Assessment Agency (PBL). Emission Database for Global Atmospheric Research (EDGAR): http://edgar.jrc.ec.europa.eu/.
Categories, topics:
Climate Change, Environment
Last updated:
apr 23, 2017
Indicators value changes by year
Meaning:
6.16
Minimum:
-4.184
jan 1, 2005
Maximum:
15.901
jan 1, 2003
At the date of observation
Value
Absolute change
Change from the previous value
jan 1, 1992
0.786
+0.786
0.0%
jan 1, 1993
13.315
+12.529
1.59K%
jan 1, 1994
8.13
-5.185
-38.94%
jan 1, 1995
6.061
-2.068
-25.44%
jan 1, 1996
4.091
-1.971
-32.51%
jan 1, 1997
-0.969
-5.059
-123.68%
jan 1, 1998
-2.835
-1.866
192.65%
jan 1, 1999
-3.413
-0.578
20.4%
jan 1, 2000
7.428
+10.841
-317.64%
jan 1, 2001
0.989
-6.439
-86.69%
jan 1, 2002
-1.209
-2.197
-222.22%
jan 1, 2003
15.901
+17.11
-1.42K%
jan 1, 2004
14.843
-1.058
-6.66%
jan 1, 2005
-4.184
-19.027
-128.19%
jan 1, 2006
6.875
+11.059
-264.33%
jan 1, 2007
6.175
-0.701
-10.19%
jan 1, 2008
8.024
+1.849
29.95%
jan 1, 2009
9.361
+1.337
16.66%
jan 1, 2010
10.184
+0.823
8.79%
jan 1, 2011
10.877
+0.694
6.81%
jan 1, 2012
11.986
+1.109
10.19%
jan 1, 2013
13.095
+1.109
9.25%
Ranking of countries by current statistics by years