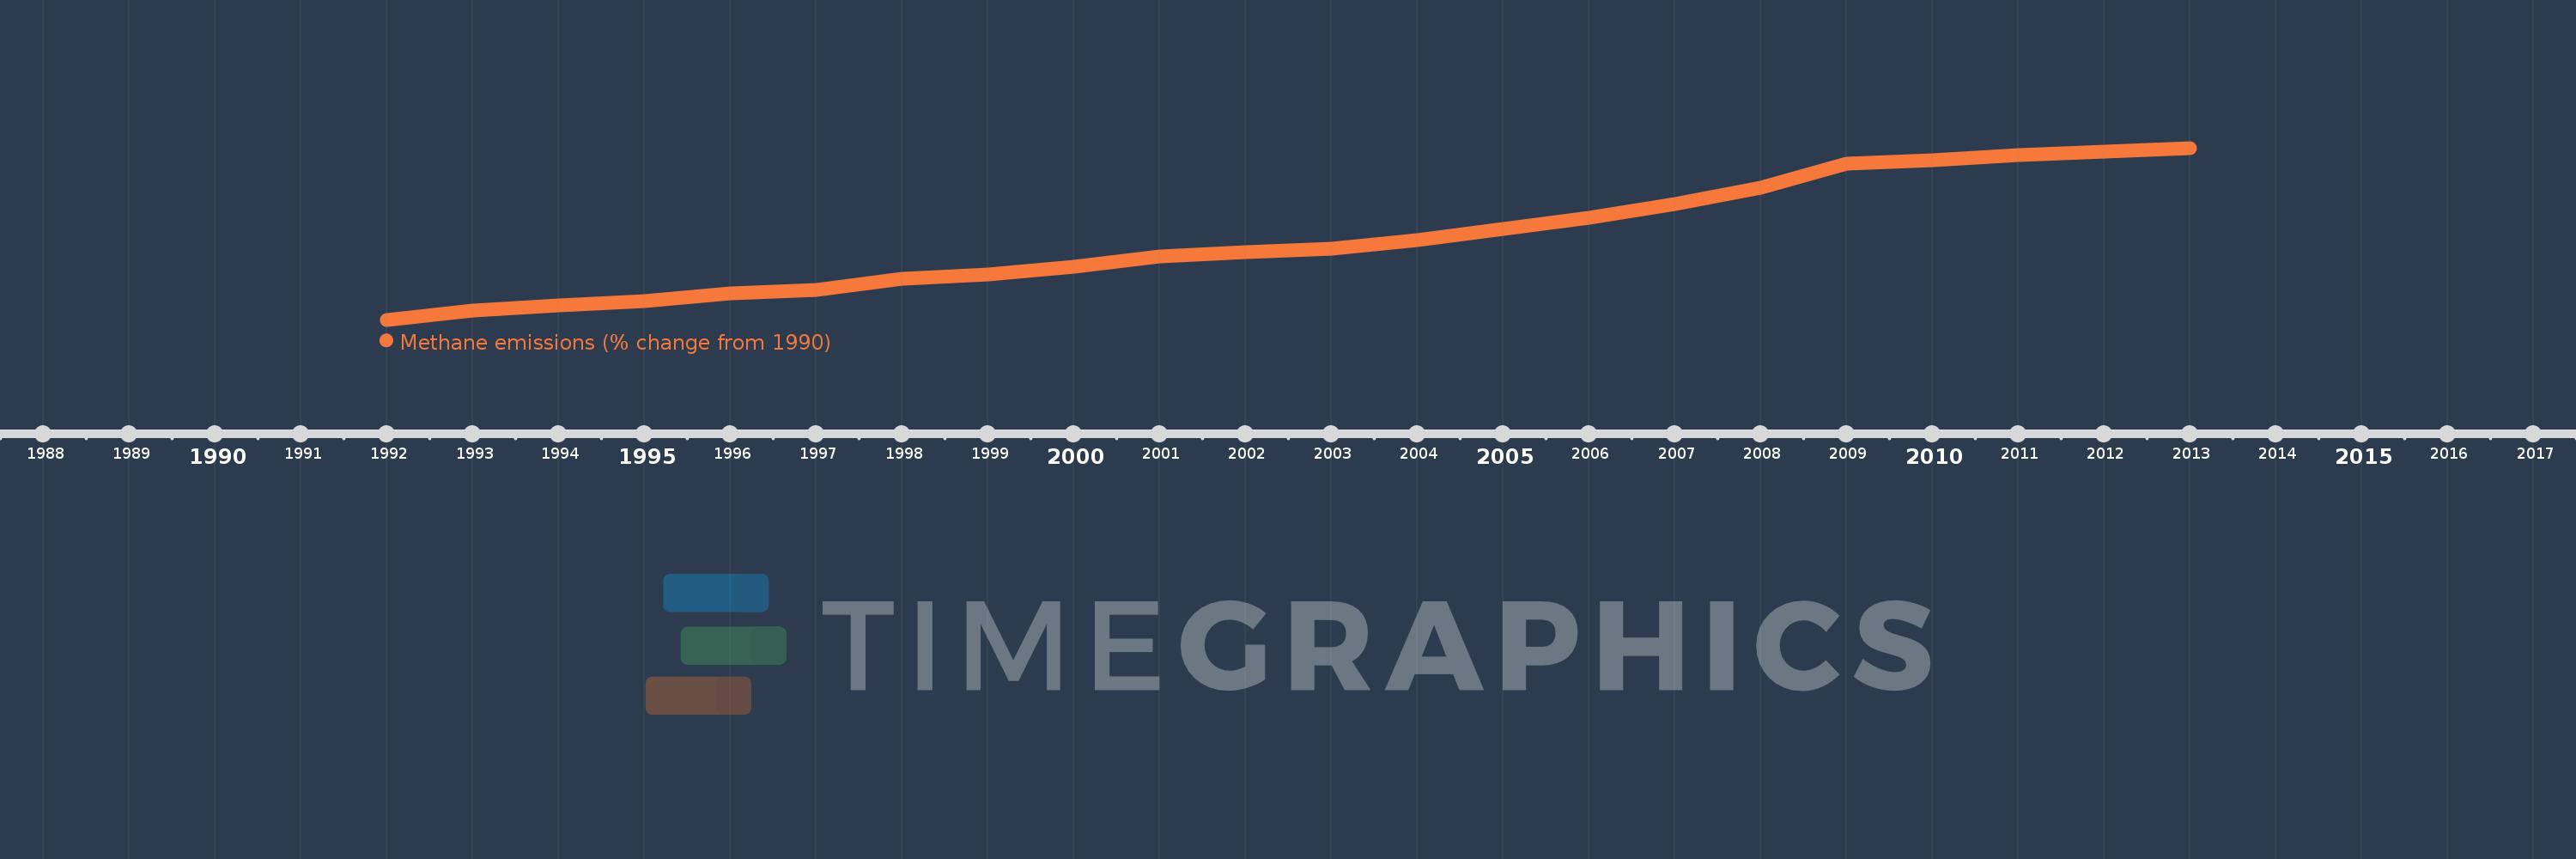
This timeline shows a graph from 1992 to 2013 of Turkey. No data until 1991. Number of actual observations by date: 22.
Source name:
World Development Indicators
Source organization:
World Bank staff estimates from original source: European Commission, Joint Research Centre (JRC)/Netherlands Environmental Assessment Agency (PBL). Emission Database for Global Atmospheric Research (EDGAR): http://edgar.jrc.ec.europa.eu/.
Categories, topics:
Climate Change, Environment
Last updated:
apr 23, 2017
Indicators value changes by year
Meaning:
36.742
Minimum:
-1.586
jan 1, 1992
Maximum:
79.816
jan 1, 2013
At the date of observation
Value
Absolute change
Change from the previous value
jan 1, 1992
-1.586
-1.586
0.0%
jan 1, 1993
2.852
+4.437
-279.86%
jan 1, 1994
5.157
+2.305
80.84%
jan 1, 1995
7.168
+2.01
38.98%
jan 1, 1996
10.827
+3.659
51.05%
jan 1, 1997
12.717
+1.89
17.45%
jan 1, 1998
17.821
+5.105
40.14%
jan 1, 1999
19.867
+2.045
11.48%
jan 1, 2000
23.654
+3.787
19.06%
jan 1, 2001
28.298
+4.644
19.63%
jan 1, 2002
30.464
+2.166
7.65%
jan 1, 2003
32.188
+1.725
5.66%
jan 1, 2004
35.948
+3.76
11.68%
jan 1, 2005
41.297
+5.348
14.88%
jan 1, 2006
46.754
+5.458
13.22%
jan 1, 2007
53.196
+6.442
13.78%
jan 1, 2008
61.037
+7.84
14.74%
jan 1, 2009
72.51
+11.474
18.8%
jan 1, 2010
73.997
+1.487
2.05%
jan 1, 2011
76.29
+2.293
3.1%
jan 1, 2012
78.053
+1.763
2.31%
jan 1, 2013
79.816
+1.763
2.26%
Ranking of countries by current statistics by years