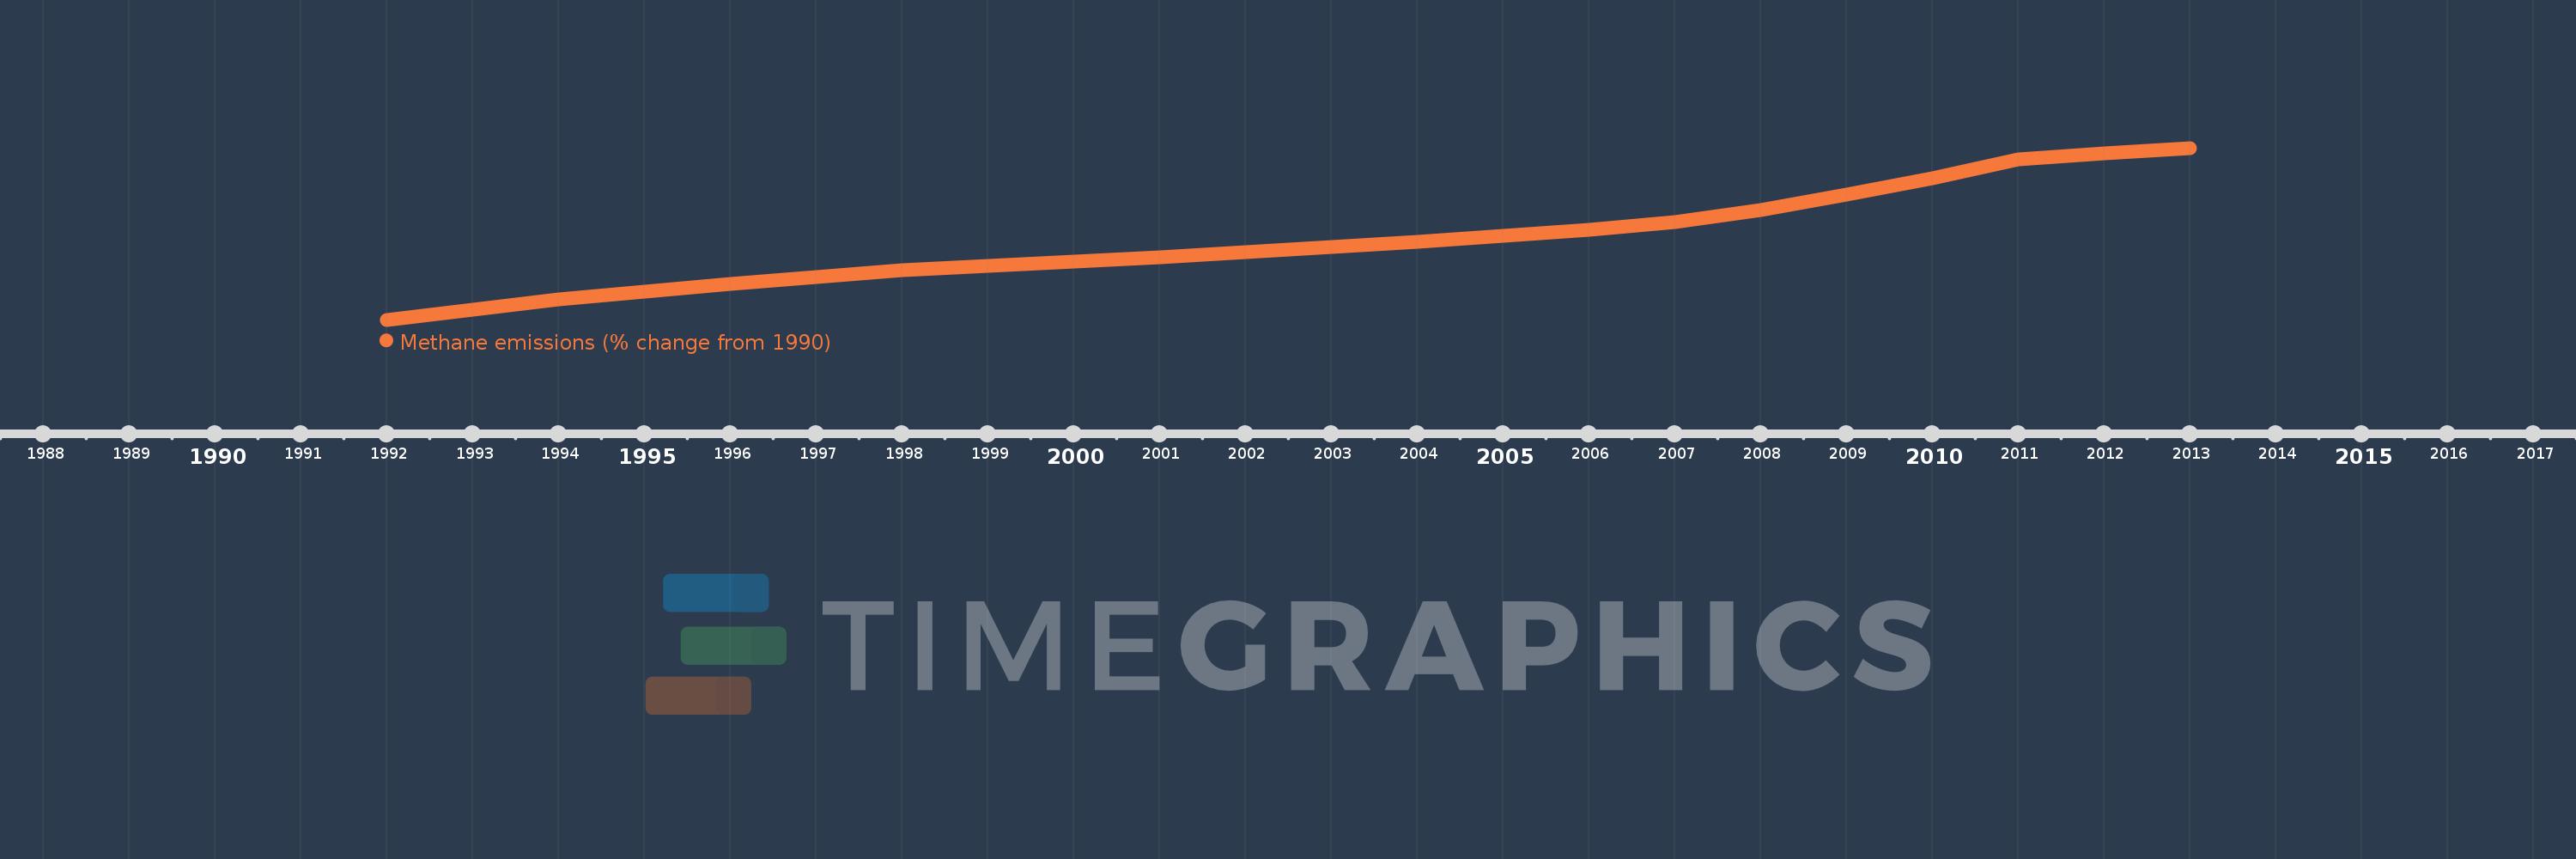
This timeline shows a graph from 1992 to 2013 of American Samoa. No data until 1991. Number of actual observations by date: 22.
Source name:
World Development Indicators
Source organization:
World Bank staff estimates from original source: European Commission, Joint Research Centre (JRC)/Netherlands Environmental Assessment Agency (PBL). Emission Database for Global Atmospheric Research (EDGAR): http://edgar.jrc.ec.europa.eu/.
Categories, topics:
Climate Change, Environment
Last updated:
apr 23, 2017
Indicators value changes by year
Meaning:
23.775
Minimum:
3.119
jan 1, 1992
Maximum:
48.343
jan 1, 2013
At the date of observation
Value
Absolute change
Change from the previous value
jan 1, 1992
3.119
+3.119
0.0%
jan 1, 1993
5.869
+2.749
88.15%
jan 1, 1994
8.37
+2.501
42.62%
jan 1, 1995
10.601
+2.231
26.65%
jan 1, 1996
12.635
+2.034
19.19%
jan 1, 1997
14.464
+1.829
14.47%
jan 1, 1998
16.069
+1.605
11.1%
jan 1, 1999
17.277
+1.208
7.52%
jan 1, 2000
18.45
+1.173
6.79%
jan 1, 2001
19.546
+1.096
5.94%
jan 1, 2002
20.951
+1.405
7.19%
jan 1, 2003
22.323
+1.372
6.55%
jan 1, 2004
23.583
+1.26
5.64%
jan 1, 2005
25.123
+1.541
6.53%
jan 1, 2006
26.862
+1.738
6.92%
jan 1, 2007
28.752
+1.89
7.04%
jan 1, 2008
31.918
+3.166
11.01%
jan 1, 2009
36.095
+4.177
13.09%
jan 1, 2010
40.38
+4.286
11.87%
jan 1, 2011
45.434
+5.054
12.52%
jan 1, 2012
46.888
+1.454
3.2%
jan 1, 2013
48.343
+1.454
3.1%
Ranking of countries by current statistics by years