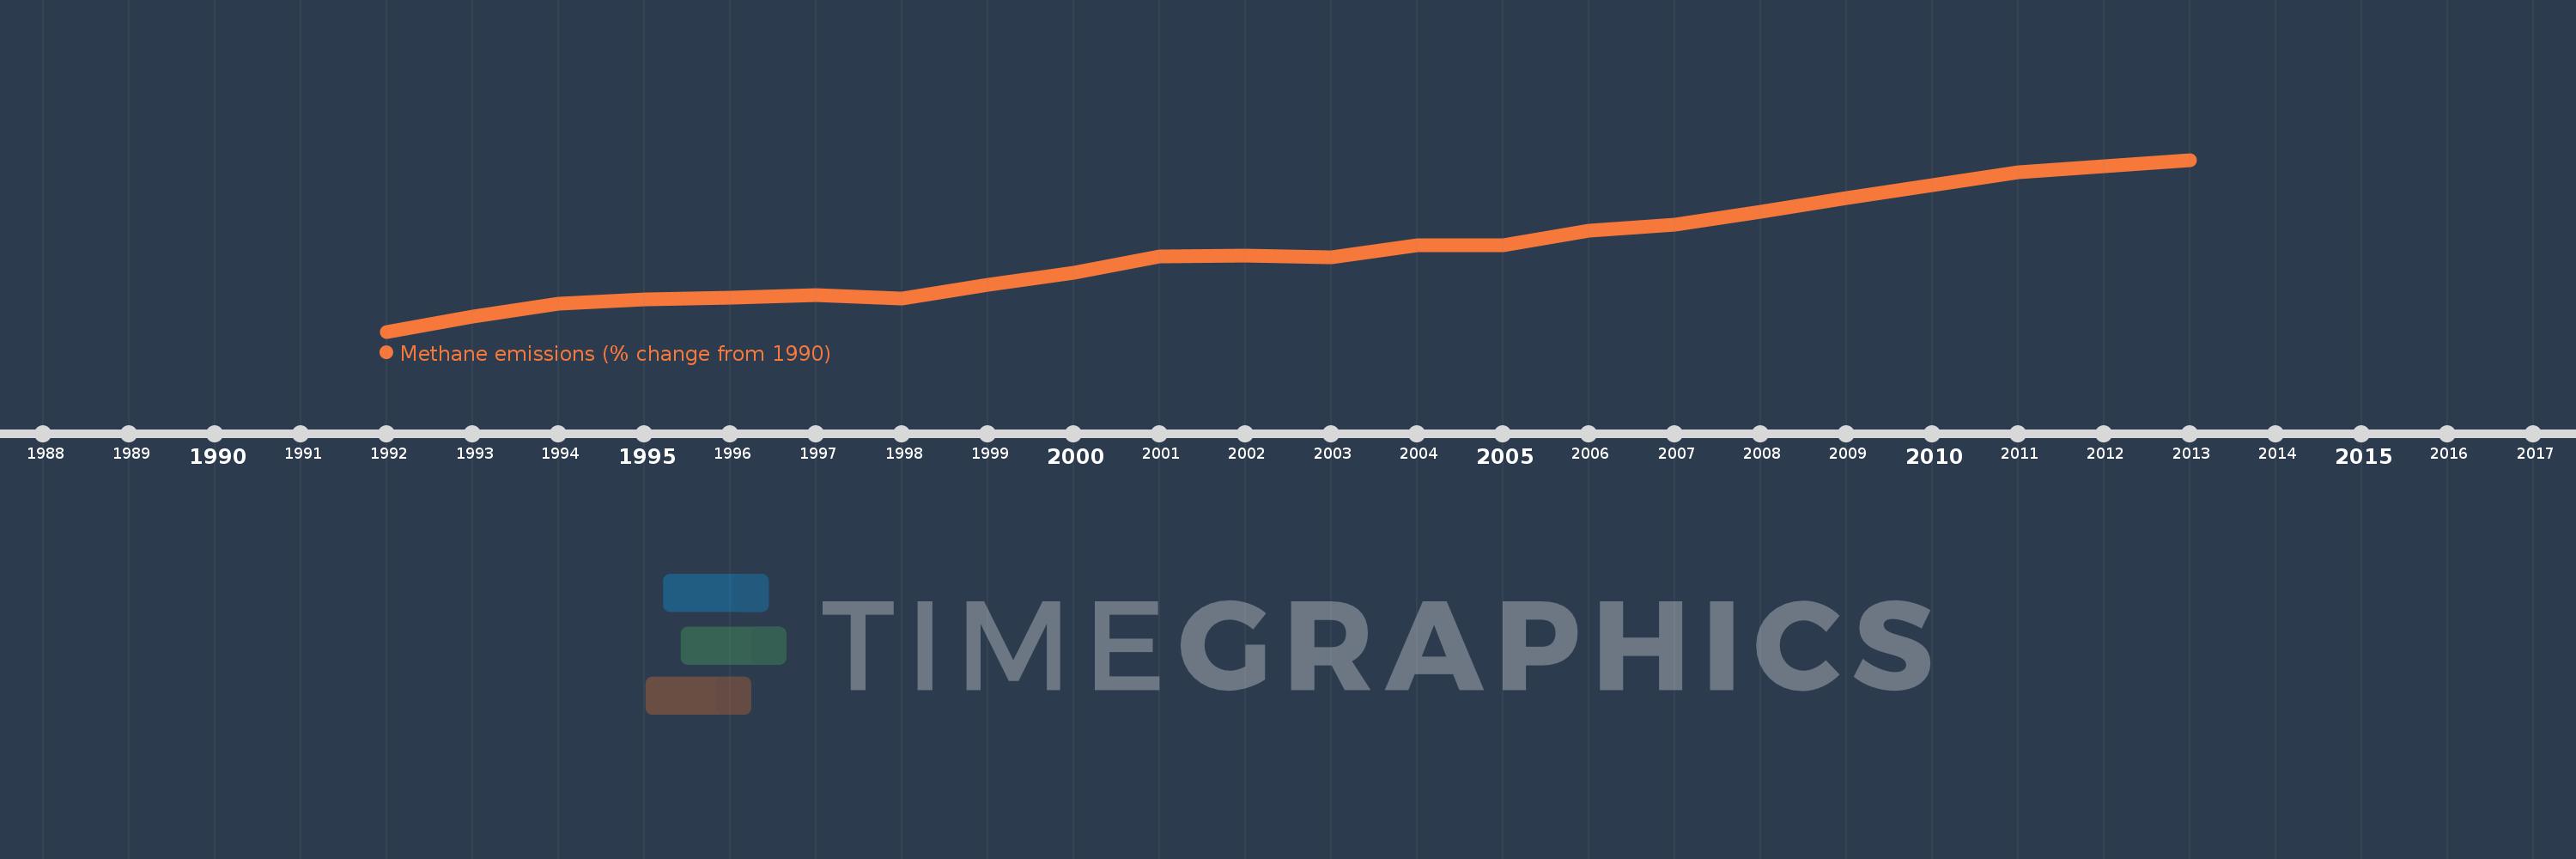
This timeline shows a graph from 1992 to 2013 of French Polynesia. No data until 1991. Number of actual observations by date: 22.
Source name:
World Development Indicators
Source organization:
World Bank staff estimates from original source: European Commission, Joint Research Centre (JRC)/Netherlands Environmental Assessment Agency (PBL). Emission Database for Global Atmospheric Research (EDGAR): http://edgar.jrc.ec.europa.eu/.
Categories, topics:
Climate Change, Environment
Last updated:
apr 23, 2017
Indicators value changes by year
Meaning:
20.368
Minimum:
2.645
jan 1, 1992
Maximum:
40.141
jan 1, 2013
At the date of observation
Value
Absolute change
Change from the previous value
jan 1, 1992
2.645
+2.645
0.0%
jan 1, 1993
5.924
+3.279
123.97%
jan 1, 1994
8.67
+2.746
46.36%
jan 1, 1995
9.615
+0.945
10.9%
jan 1, 1996
10.037
+0.422
4.39%
jan 1, 1997
10.57
+0.533
5.31%
jan 1, 1998
9.845
-0.724
-6.85%
jan 1, 1999
12.864
+3.018
30.66%
jan 1, 2000
15.522
+2.658
20.66%
jan 1, 2001
19.071
+3.549
22.86%
jan 1, 2002
19.21
+0.139
0.73%
jan 1, 2003
18.827
-0.383
-1.99%
jan 1, 2004
21.471
+2.644
14.04%
jan 1, 2005
21.505
+0.034
0.16%
jan 1, 2006
24.718
+3.213
14.94%
jan 1, 2007
25.951
+1.234
4.99%
jan 1, 2008
28.871
+2.92
11.25%
jan 1, 2009
31.829
+2.958
10.25%
jan 1, 2010
34.645
+2.816
8.85%
jan 1, 2011
37.393
+2.748
7.93%
jan 1, 2012
38.767
+1.374
3.67%
jan 1, 2013
40.141
+1.374
3.54%
Ranking of countries by current statistics by years