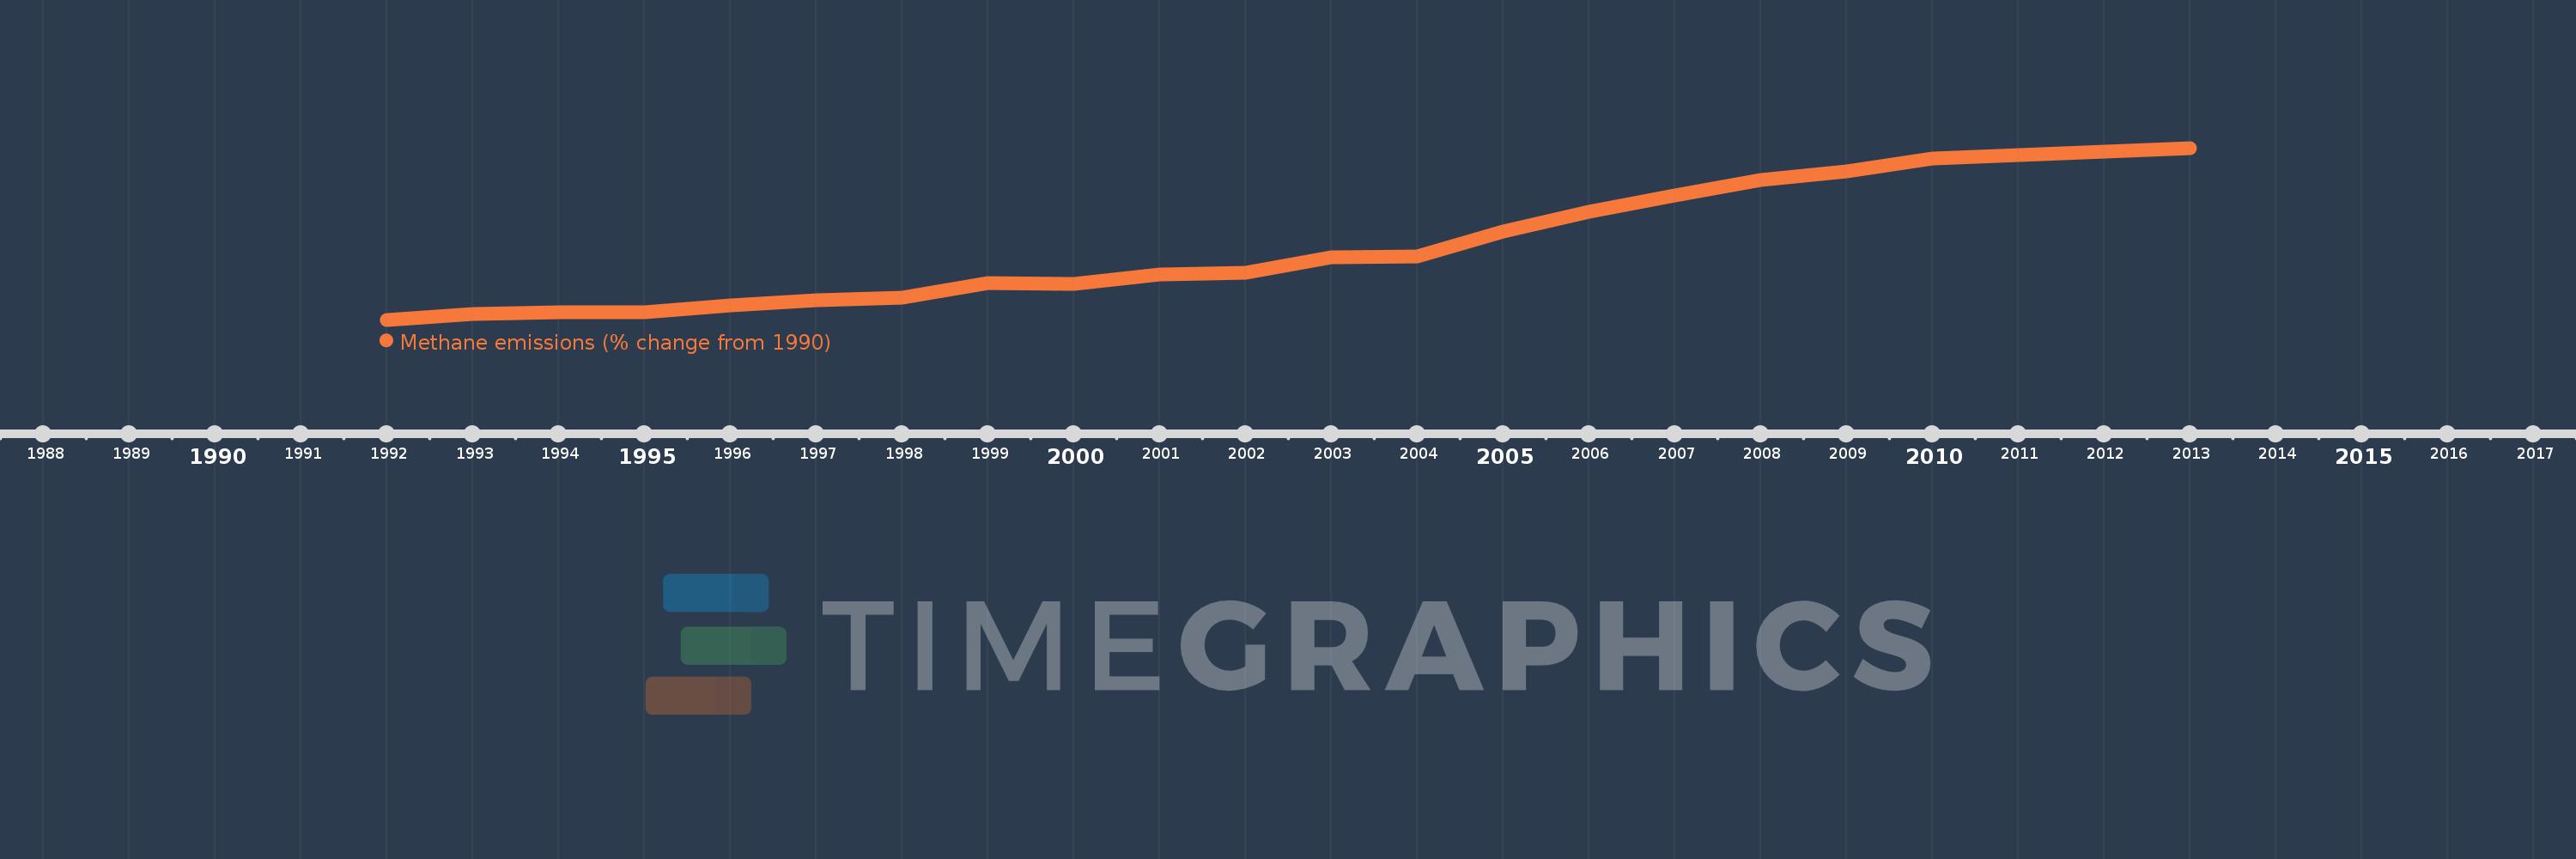
This timeline shows a graph from 1992 to 2013 of Vietnam. No data until 1991. Number of actual observations by date: 22.
Source name:
World Development Indicators
Source organization:
World Bank staff estimates from original source: European Commission, Joint Research Centre (JRC)/Netherlands Environmental Assessment Agency (PBL). Emission Database for Global Atmospheric Research (EDGAR): http://edgar.jrc.ec.europa.eu/.
Categories, topics:
Climate Change, Environment
Last updated:
apr 23, 2017
Indicators value changes by year
Meaning:
39.309
Minimum:
2.127
jan 1, 1992
Maximum:
87.79
jan 1, 2013
At the date of observation
Value
Absolute change
Change from the previous value
jan 1, 1992
2.127
+2.127
0.0%
jan 1, 1993
4.844
+2.718
127.81%
jan 1, 1994
5.651
+0.806
16.64%
jan 1, 1995
5.773
+0.122
2.16%
jan 1, 1996
9.264
+3.491
60.48%
jan 1, 1997
11.691
+2.427
26.2%
jan 1, 1998
13.2
+1.509
12.91%
jan 1, 1999
20.395
+7.195
54.51%
jan 1, 2000
20.162
-0.233
-1.14%
jan 1, 2001
24.731
+4.57
22.66%
jan 1, 2002
25.552
+0.821
3.32%
jan 1, 2003
33.319
+7.767
30.4%
jan 1, 2004
33.571
+0.252
0.76%
jan 1, 2005
46.209
+12.638
37.65%
jan 1, 2006
56.01
+9.801
21.21%
jan 1, 2007
64.267
+8.257
14.74%
jan 1, 2008
71.808
+7.541
11.73%
jan 1, 2009
76.027
+4.218
5.87%
jan 1, 2010
82.357
+6.33
8.33%
jan 1, 2011
84.108
+1.751
2.13%
jan 1, 2012
85.949
+1.841
2.19%
jan 1, 2013
87.79
+1.841
2.14%
Ranking of countries by current statistics by years