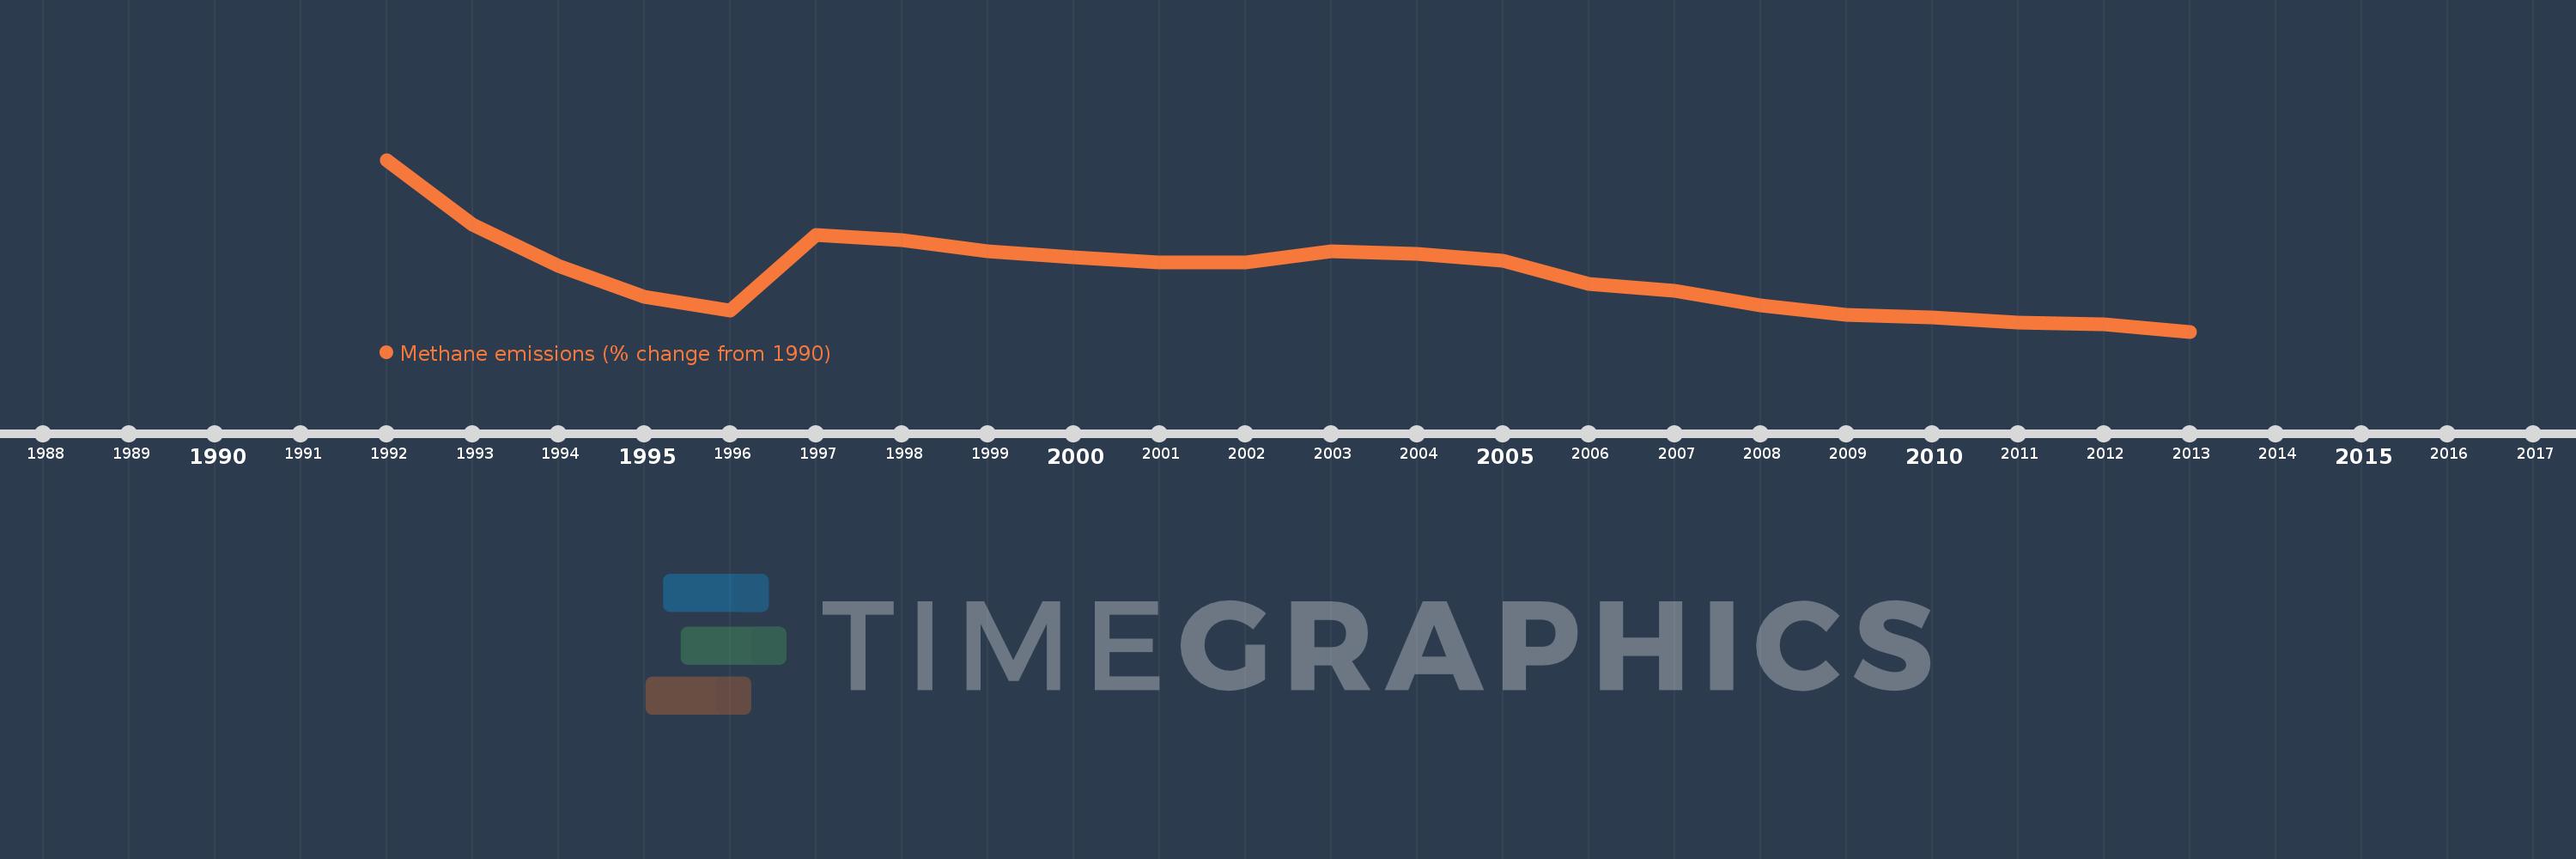
This timeline shows a graph from 1992 to 2013 of Hungary. No data until 1991. Number of actual observations by date: 22.
Source name:
World Development Indicators
Source organization:
World Bank staff estimates from original source: European Commission, Joint Research Centre (JRC)/Netherlands Environmental Assessment Agency (PBL). Emission Database for Global Atmospheric Research (EDGAR): http://edgar.jrc.ec.europa.eu/.
Categories, topics:
Climate Change, Environment
Last updated:
apr 23, 2017
Indicators value changes by year
Meaning:
-19.891
Minimum:
-29.131
jan 1, 2013
Maximum:
-1.659
jan 1, 1992
At the date of observation
Value
Absolute change
Change from the previous value
jan 1, 1992
-1.659
-1.659
0.0%
jan 1, 1993
-12.065
-10.406
627.34%
jan 1, 1994
-18.588
-6.523
54.07%
jan 1, 1995
-23.512
-4.924
26.49%
jan 1, 1996
-25.707
-2.195
9.34%
jan 1, 1997
-13.739
+11.969
-46.56%
jan 1, 1998
-14.544
-0.805
5.86%
jan 1, 1999
-16.352
-1.808
12.43%
jan 1, 2000
-17.271
-0.92
5.62%
jan 1, 2001
-18.14
-0.869
5.03%
jan 1, 2002
-18.05
+0.089
-0.49%
jan 1, 2003
-16.236
+1.815
-10.05%
jan 1, 2004
-16.717
-0.481
2.96%
jan 1, 2005
-17.821
-1.104
6.61%
jan 1, 2006
-21.532
-3.711
20.82%
jan 1, 2007
-22.631
-1.099
5.1%
jan 1, 2008
-24.975
-2.345
10.36%
jan 1, 2009
-26.402
-1.427
5.71%
jan 1, 2010
-26.87
-0.468
1.77%
jan 1, 2011
-27.663
-0.793
2.95%
jan 1, 2012
-28.0
-0.337
1.22%
jan 1, 2013
-29.131
-1.13
4.04%
Ranking of countries by current statistics by years