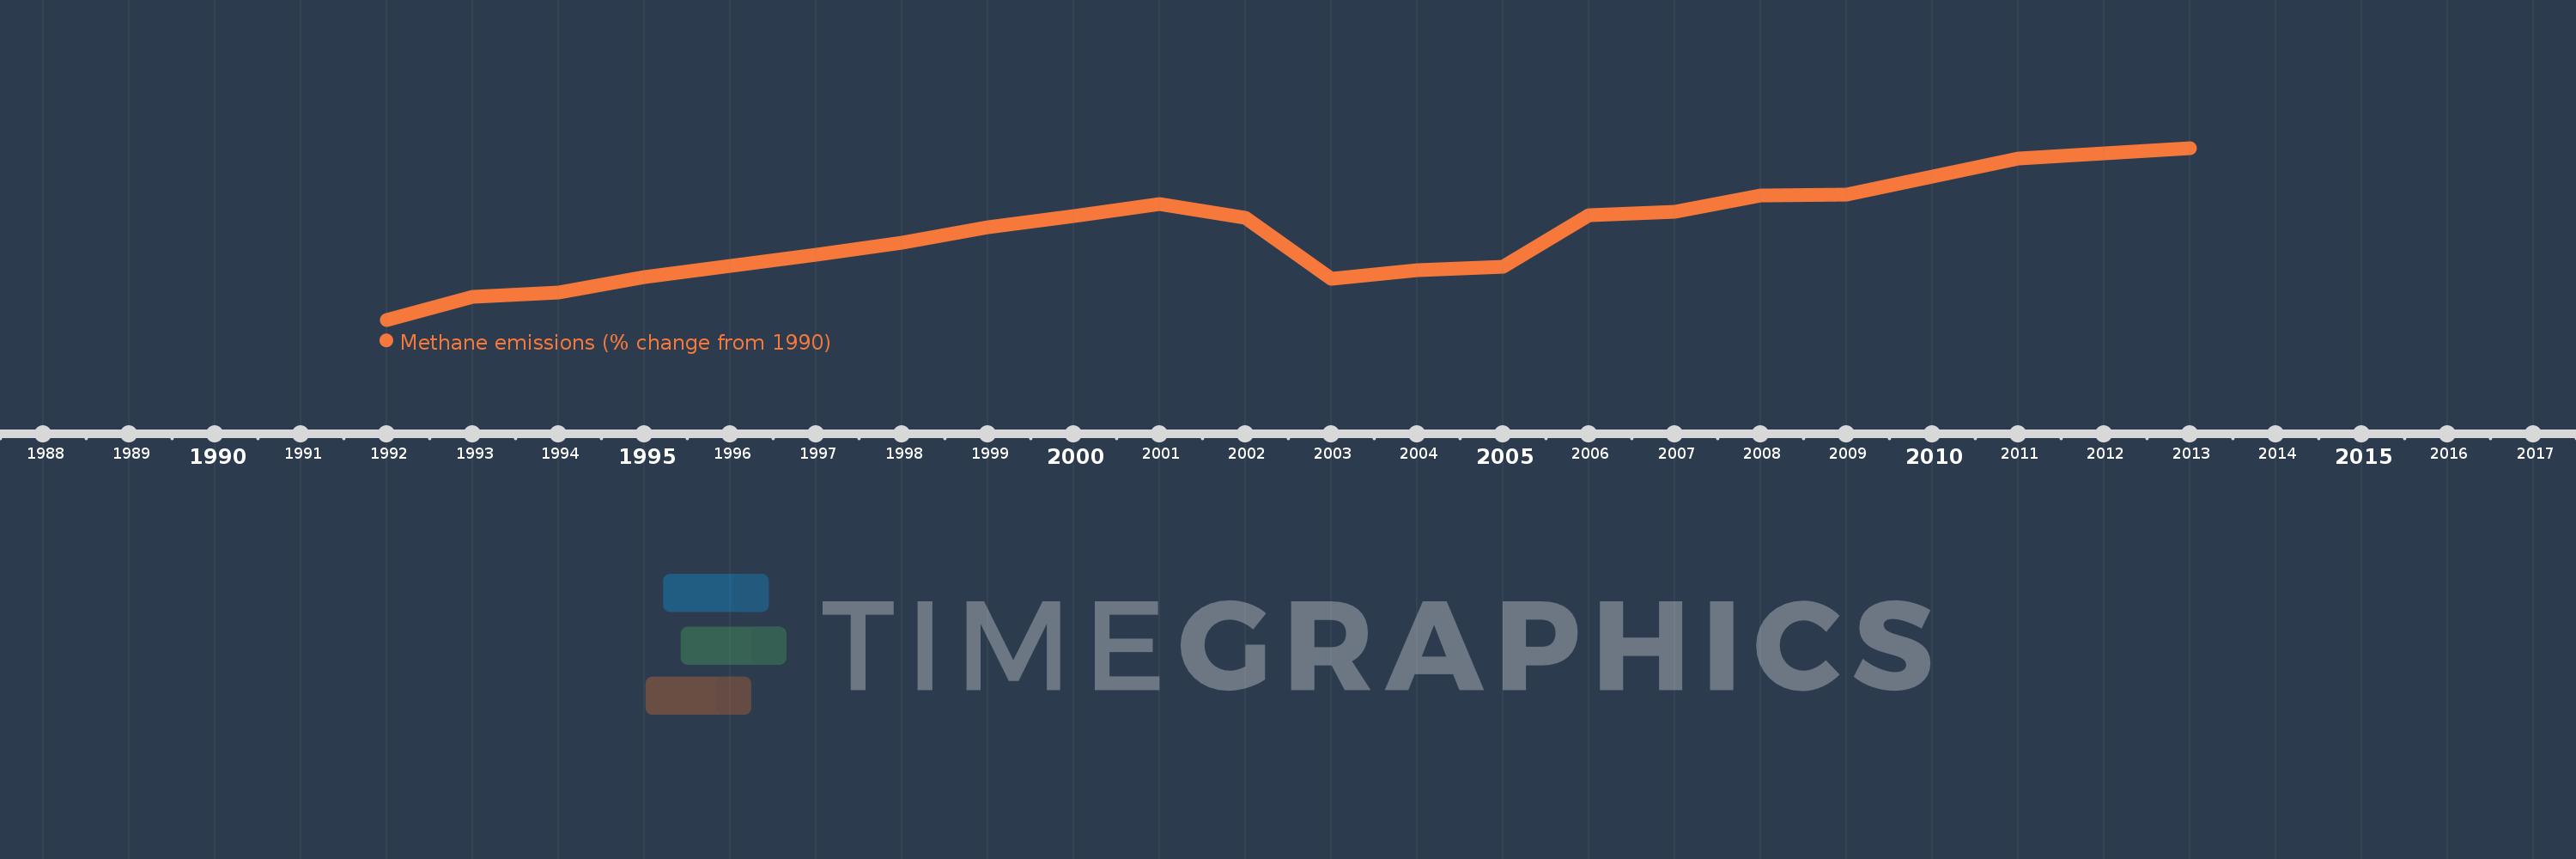
This timeline shows a graph from 1992 to 2013 of Niger. No data until 1991. Number of actual observations by date: 22.
Source name:
World Development Indicators
Source organization:
World Bank staff estimates from original source: European Commission, Joint Research Centre (JRC)/Netherlands Environmental Assessment Agency (PBL). Emission Database for Global Atmospheric Research (EDGAR): http://edgar.jrc.ec.europa.eu/.
Categories, topics:
Climate Change, Environment
Last updated:
apr 23, 2017
Indicators value changes by year
Meaning:
29.38
Minimum:
3.451
jan 1, 1992
Maximum:
53.68
jan 1, 2013
At the date of observation
Value
Absolute change
Change from the previous value
jan 1, 1992
3.451
+3.451
0.0%
jan 1, 1993
10.169
+6.718
194.65%
jan 1, 1994
11.373
+1.204
11.84%
jan 1, 1995
15.975
+4.603
40.47%
jan 1, 1996
19.091
+3.115
19.5%
jan 1, 1997
22.408
+3.317
17.37%
jan 1, 1998
25.998
+3.591
16.02%
jan 1, 1999
30.411
+4.413
16.97%
jan 1, 2000
33.735
+3.325
10.93%
jan 1, 2001
37.218
+3.483
10.32%
jan 1, 2002
33.368
-3.851
-10.35%
jan 1, 2003
15.452
-17.915
-53.69%
jan 1, 2004
17.829
+2.377
15.38%
jan 1, 2005
19.035
+1.206
6.77%
jan 1, 2006
33.996
+14.961
78.59%
jan 1, 2007
35.082
+1.086
3.19%
jan 1, 2008
39.901
+4.819
13.74%
jan 1, 2009
40.123
+0.222
0.56%
jan 1, 2010
45.228
+5.106
12.73%
jan 1, 2011
50.667
+5.439
12.02%
jan 1, 2012
52.174
+1.507
2.97%
jan 1, 2013
53.68
+1.507
2.89%
Ranking of countries by current statistics by years