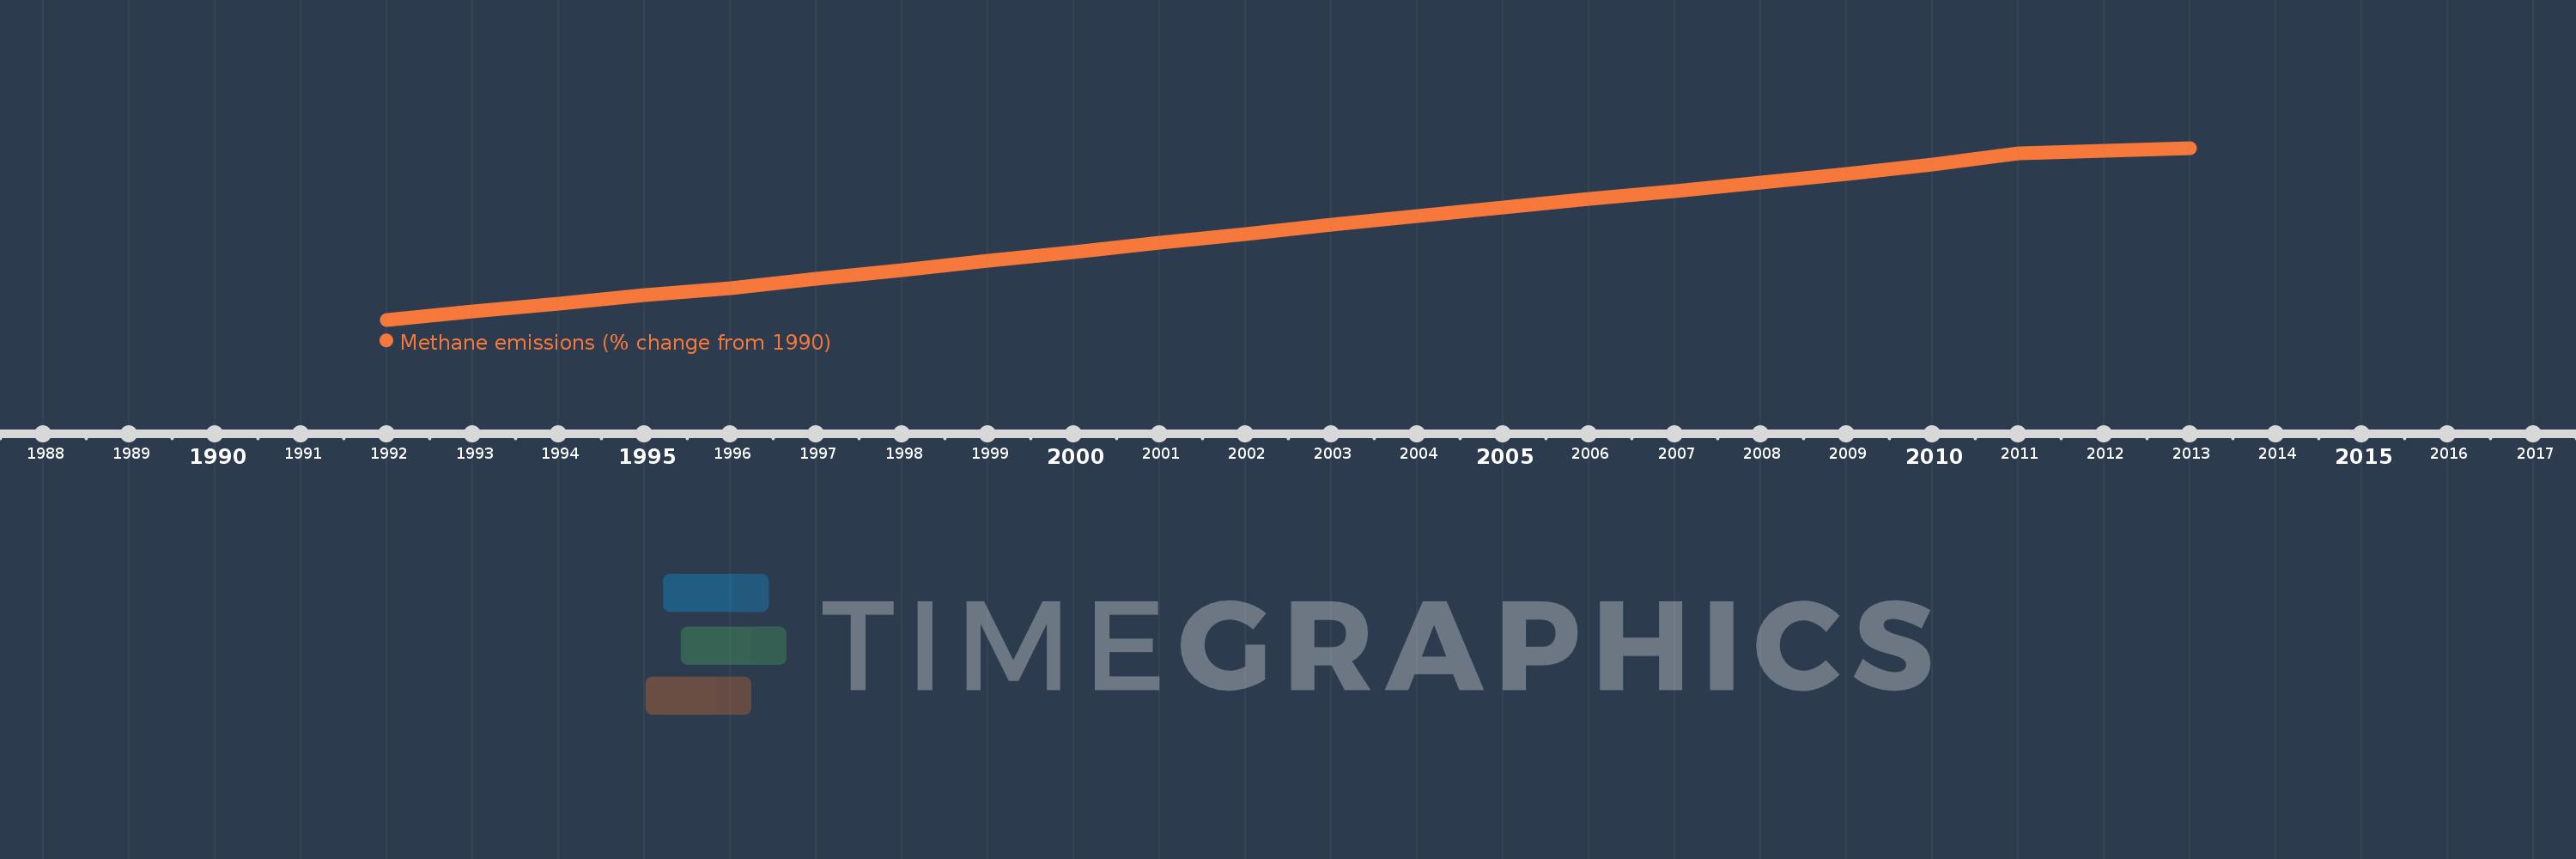
This timeline shows a graph from 1992 to 2013 of Northern Mariana Islands. No data until 1991. Number of actual observations by date: 22.
Source name:
World Development Indicators
Source organization:
World Bank staff estimates from original source: European Commission, Joint Research Centre (JRC)/Netherlands Environmental Assessment Agency (PBL). Emission Database for Global Atmospheric Research (EDGAR): http://edgar.jrc.ec.europa.eu/.
Categories, topics:
Climate Change, Environment
Last updated:
apr 23, 2017
Indicators value changes by year
Meaning:
85.674
Minimum:
6.917
jan 1, 1992
Maximum:
158.341
jan 1, 2013
At the date of observation
Value
Absolute change
Change from the previous value
jan 1, 1992
6.917
+6.917
0.0%
jan 1, 1993
13.958
+7.041
101.79%
jan 1, 1994
21.101
+7.144
51.18%
jan 1, 1995
28.403
+7.302
34.61%
jan 1, 1996
35.064
+6.661
23.45%
jan 1, 1997
42.874
+7.81
22.27%
jan 1, 1998
50.886
+8.012
18.69%
jan 1, 1999
58.858
+7.972
15.67%
jan 1, 2000
66.828
+7.97
13.54%
jan 1, 2001
74.632
+7.804
11.68%
jan 1, 2002
82.592
+7.96
10.67%
jan 1, 2003
90.438
+7.845
9.5%
jan 1, 2004
98.162
+7.725
8.54%
jan 1, 2005
105.913
+7.751
7.9%
jan 1, 2006
113.635
+7.722
7.29%
jan 1, 2007
120.233
+6.599
5.81%
jan 1, 2008
127.482
+7.249
6.03%
jan 1, 2009
135.439
+7.957
6.24%
jan 1, 2010
143.981
+8.542
6.31%
jan 1, 2011
153.275
+9.294
6.46%
jan 1, 2012
155.808
+2.533
1.65%
jan 1, 2013
158.341
+2.533
1.63%
Ranking of countries by current statistics by years