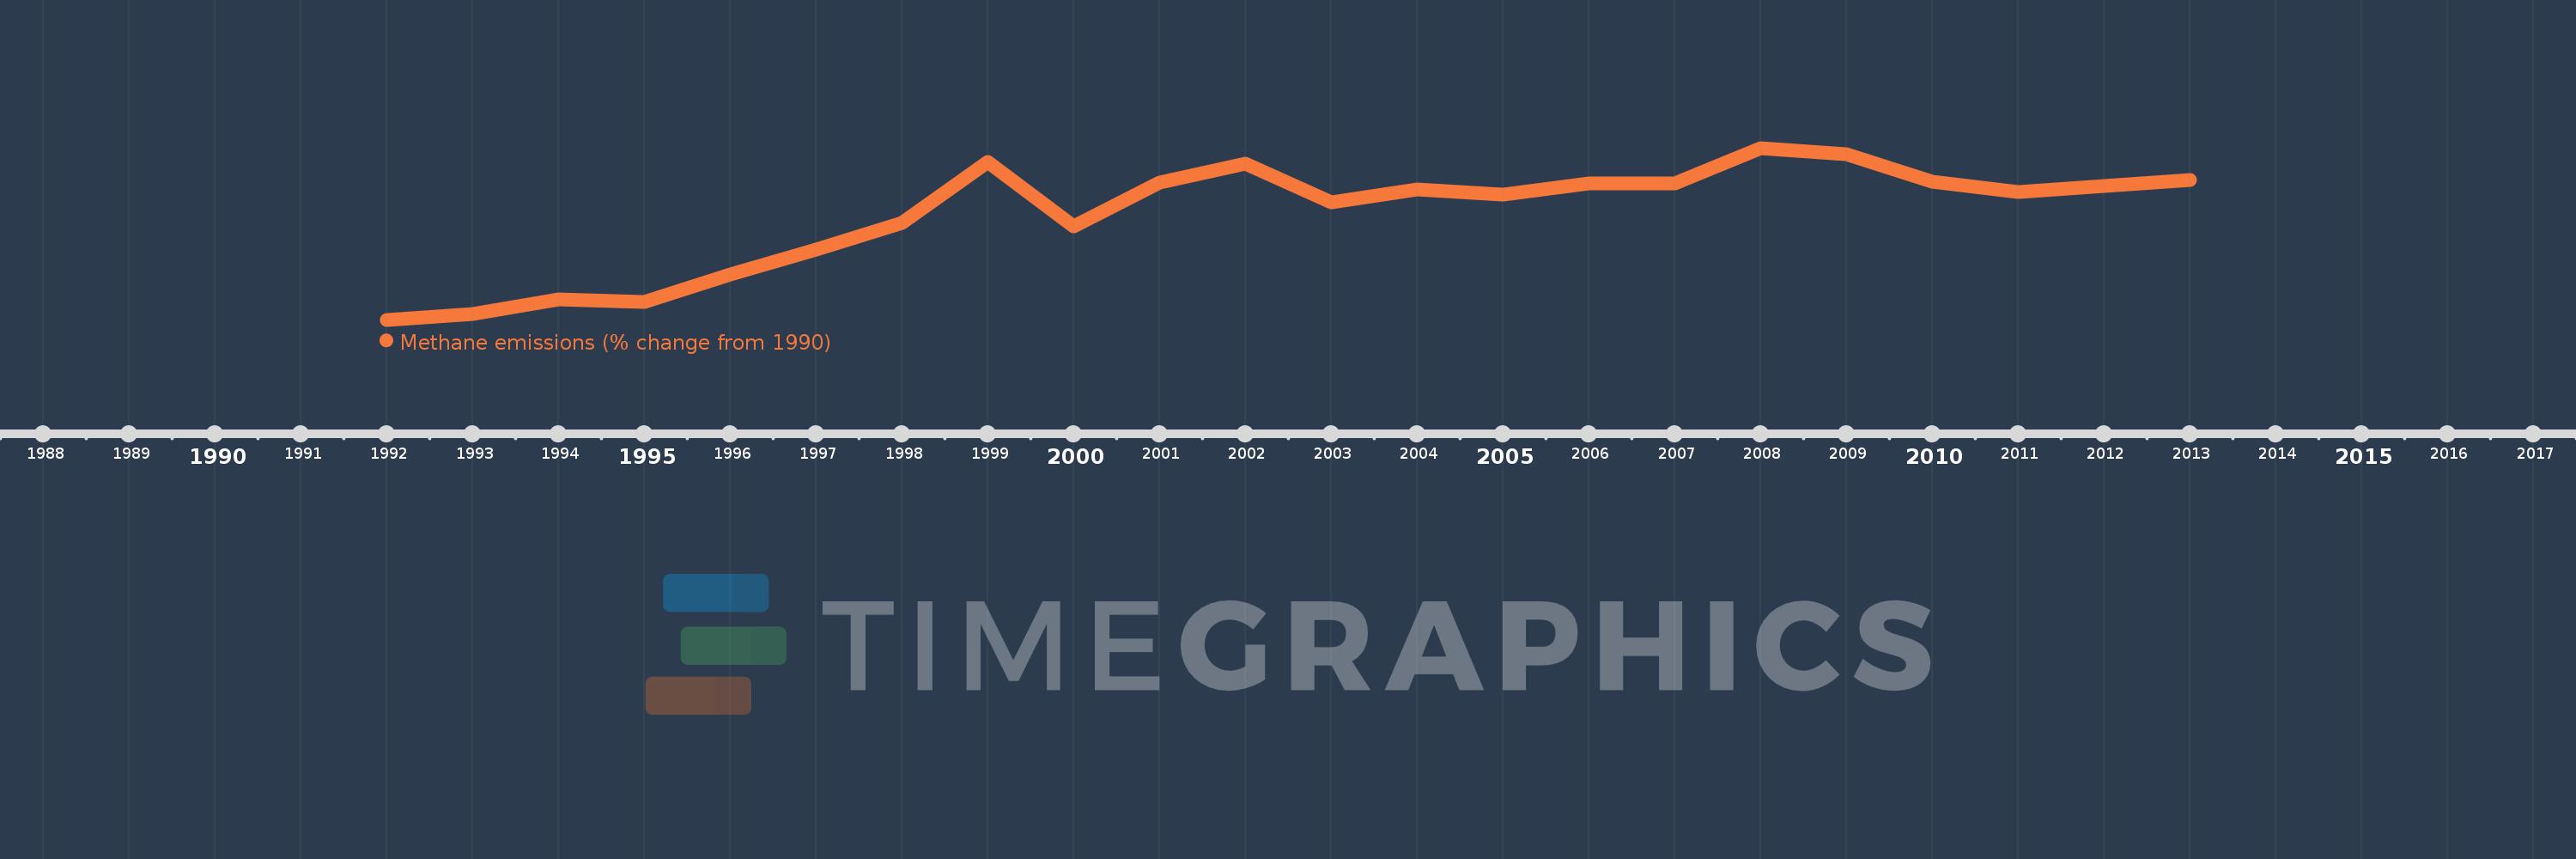
This timeline shows a graph from 1992 to 2013 of Venezuela, RB. No data until 1991. Number of actual observations by date: 22.
Source name:
World Development Indicators
Source organization:
World Bank staff estimates from original source: European Commission, Joint Research Centre (JRC)/Netherlands Environmental Assessment Agency (PBL). Emission Database for Global Atmospheric Research (EDGAR): http://edgar.jrc.ec.europa.eu/.
Categories, topics:
Climate Change, Environment
Last updated:
apr 23, 2017
Indicators value changes by year
Meaning:
24.644
Minimum:
2.186
jan 1, 1992
Maximum:
38.754
jan 1, 2008
At the date of observation
Value
Absolute change
Change from the previous value
jan 1, 1992
2.186
+2.186
0.0%
jan 1, 1993
3.322
+1.136
52.0%
jan 1, 1994
6.556
+3.234
97.37%
jan 1, 1995
5.948
-0.609
-9.28%
jan 1, 1996
11.751
+5.803
97.57%
jan 1, 1997
17.048
+5.296
45.07%
jan 1, 1998
22.837
+5.789
33.96%
jan 1, 1999
35.833
+12.996
56.91%
jan 1, 2000
22.044
-13.788
-38.48%
jan 1, 2001
31.303
+9.259
42.0%
jan 1, 2002
35.422
+4.119
13.16%
jan 1, 2003
27.156
-8.266
-23.34%
jan 1, 2004
29.888
+2.732
10.06%
jan 1, 2005
28.841
-1.047
-3.5%
jan 1, 2006
31.241
+2.4
8.32%
jan 1, 2007
31.165
-0.076
-0.24%
jan 1, 2008
38.754
+7.589
24.35%
jan 1, 2009
37.412
-1.342
-3.46%
jan 1, 2010
31.616
-5.796
-15.49%
jan 1, 2011
29.318
-2.298
-7.27%
jan 1, 2012
30.612
+1.293
4.41%
jan 1, 2013
31.905
+1.293
4.22%
Ranking of countries by current statistics by years