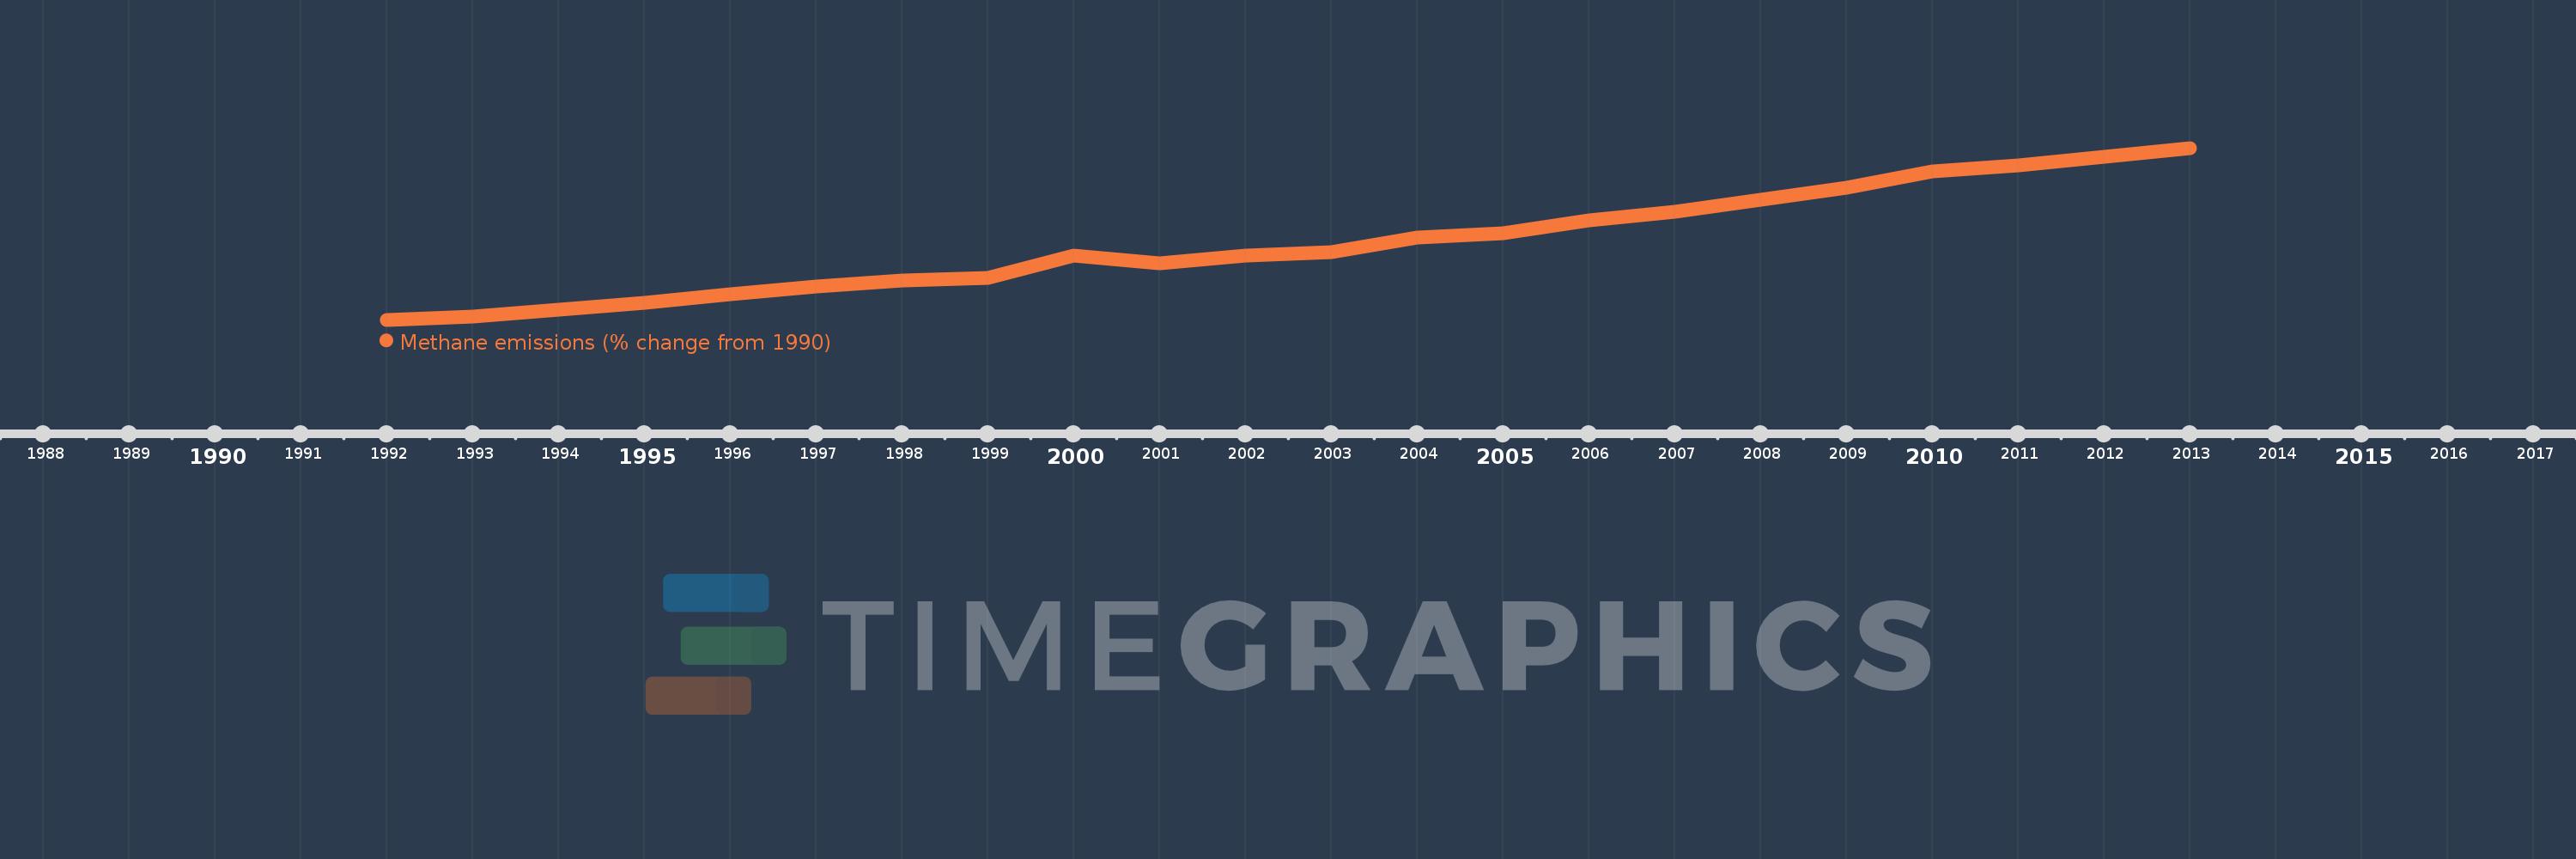
This timeline shows a graph from 1992 to 2013 of South Asia. No data until 1991. Number of actual observations by date: 22.
Source name:
World Development Indicators
Source organization:
World Bank staff estimates from original source: European Commission, Joint Research Centre (JRC)/Netherlands Environmental Assessment Agency (PBL). Emission Database for Global Atmospheric Research (EDGAR): http://edgar.jrc.ec.europa.eu/.
Categories, topics:
Climate Change, Environment
Last updated:
apr 23, 2017
Indicators value changes by year
Meaning:
13.929
Minimum:
0.982
jan 1, 1992
Maximum:
29.964
jan 1, 2013
At the date of observation
Value
Absolute change
Change from the previous value
jan 1, 1992
0.982
+0.982
0.0%
jan 1, 1993
1.461
+0.479
48.75%
jan 1, 1994
2.639
+1.178
80.63%
jan 1, 1995
3.826
+1.186
44.94%
jan 1, 1996
5.24
+1.414
36.97%
jan 1, 1997
6.641
+1.401
26.74%
jan 1, 1998
7.563
+0.922
13.88%
jan 1, 1999
8.111
+0.548
7.25%
jan 1, 2000
11.772
+3.661
45.13%
jan 1, 2001
10.573
-1.198
-10.18%
jan 1, 2002
11.788
+1.215
11.49%
jan 1, 2003
12.412
+0.624
5.29%
jan 1, 2004
14.88
+2.468
19.88%
jan 1, 2005
15.637
+0.757
5.09%
jan 1, 2006
17.754
+2.117
13.54%
jan 1, 2007
19.148
+1.394
7.85%
jan 1, 2008
21.249
+2.102
10.98%
jan 1, 2009
23.192
+1.942
9.14%
jan 1, 2010
26.009
+2.818
12.15%
jan 1, 2011
27.083
+1.073
4.13%
jan 1, 2012
28.523
+1.441
5.32%
jan 1, 2013
29.964
+1.441
5.05%
Ranking of countries by current statistics by years