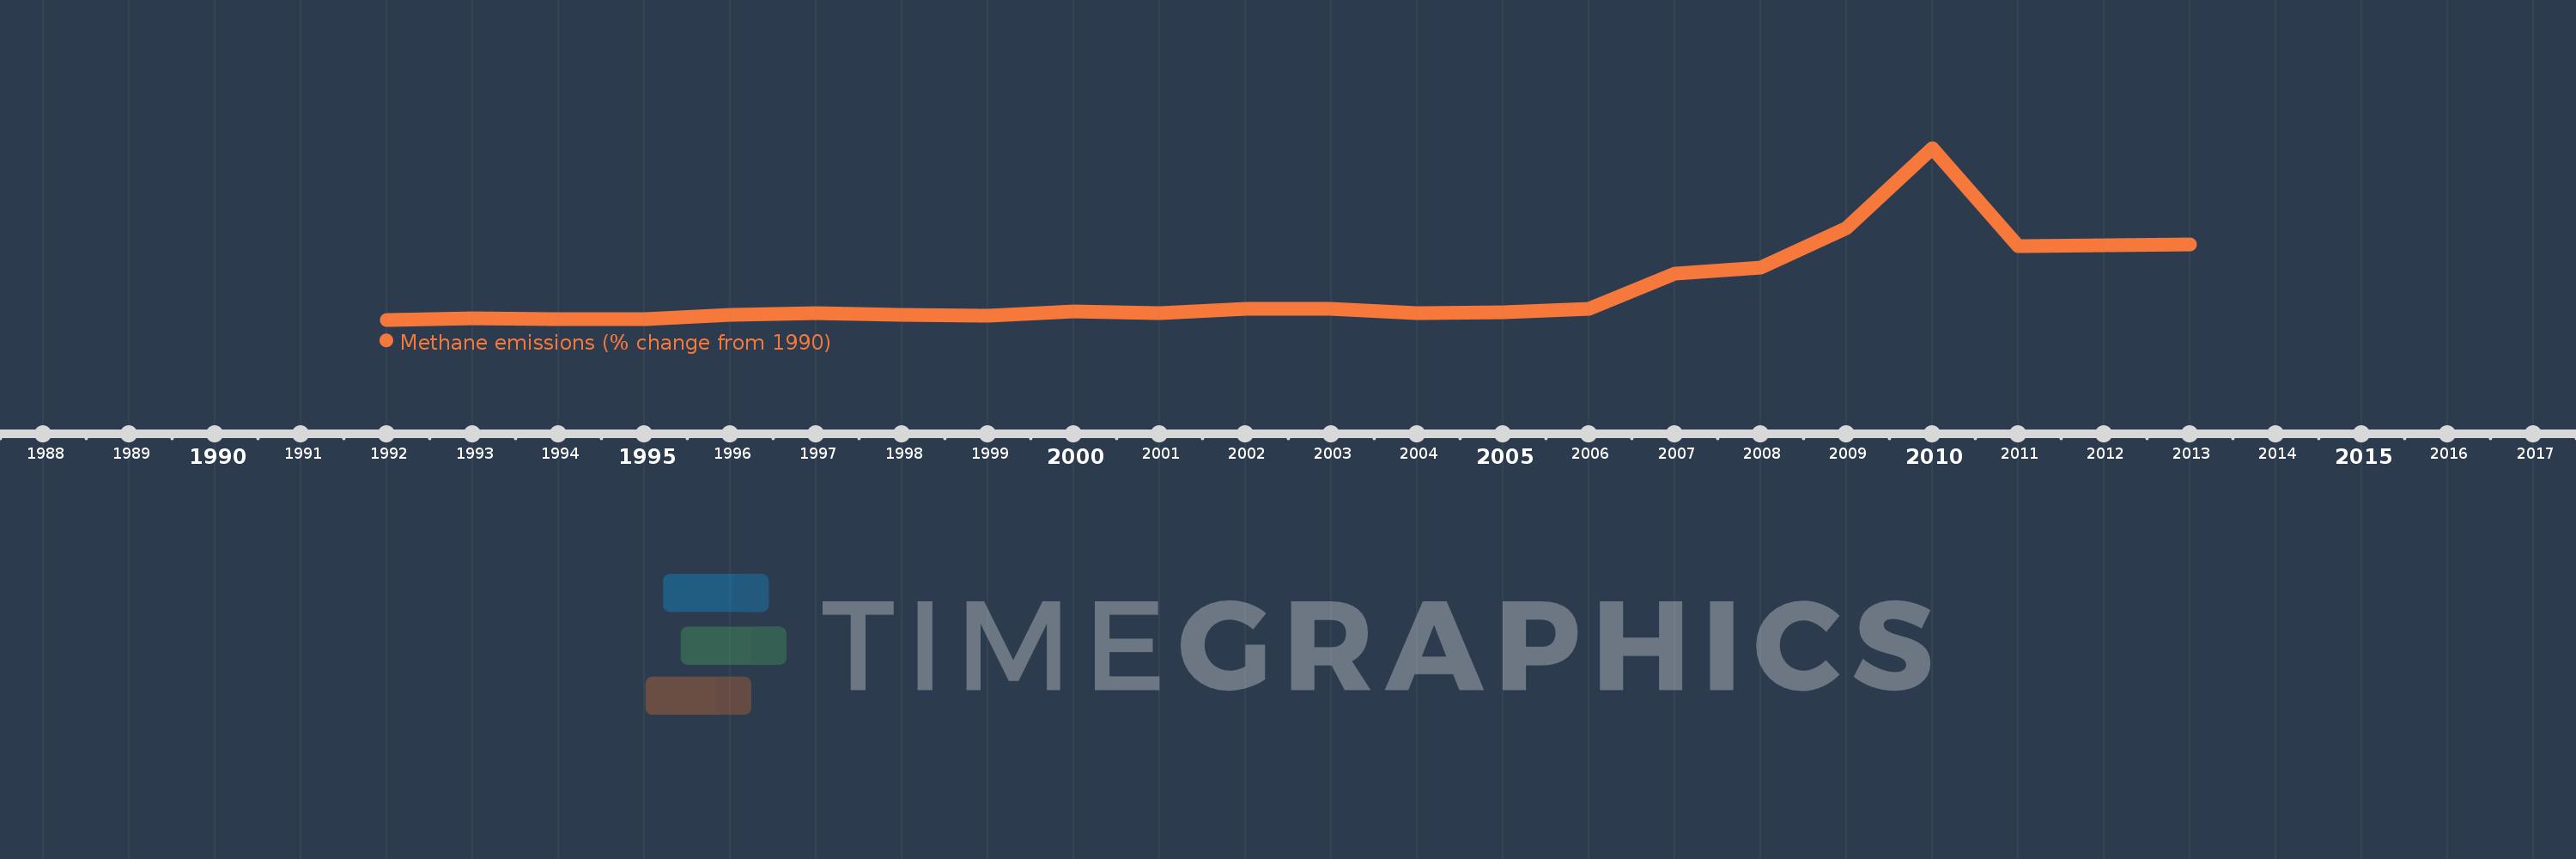
This timeline shows a graph from 1992 to 2013 of Guinea. No data until 1991. Number of actual observations by date: 22.
Source name:
World Development Indicators
Source organization:
World Bank staff estimates from original source: European Commission, Joint Research Centre (JRC)/Netherlands Environmental Assessment Agency (PBL). Emission Database for Global Atmospheric Research (EDGAR): http://edgar.jrc.ec.europa.eu/.
Categories, topics:
Climate Change, Environment
Last updated:
apr 23, 2017
Indicators value changes by year
Meaning:
80.925
Minimum:
-19.203
jan 1, 1992
Maximum:
546.328
jan 1, 2010
At the date of observation
Value
Absolute change
Change from the previous value
jan 1, 1992
-19.203
-19.203
0.0%
jan 1, 1993
-13.174
+6.029
-31.4%
jan 1, 1994
-17.242
-4.068
30.88%
jan 1, 1995
-16.248
+0.994
-5.76%
jan 1, 1996
-3.612
+12.636
-77.77%
jan 1, 1997
1.597
+5.208
-144.21%
jan 1, 1998
-4.437
-6.033
-377.84%
jan 1, 1999
-6.139
-1.702
38.37%
jan 1, 2000
8.883
+15.022
-244.7%
jan 1, 2001
1.189
-7.694
-86.61%
jan 1, 2002
17.74
+16.55
1.39K%
jan 1, 2003
17.974
+0.234
1.32%
jan 1, 2004
1.663
-16.311
-90.75%
jan 1, 2005
5.225
+3.562
214.18%
jan 1, 2006
16.009
+10.784
206.4%
jan 1, 2007
132.278
+116.269
726.28%
jan 1, 2008
152.329
+20.05
15.16%
jan 1, 2009
282.337
+130.009
85.35%
jan 1, 2010
546.328
+263.991
93.5%
jan 1, 2011
222.39
-323.938
-59.29%
jan 1, 2012
225.614
+3.224
1.45%
jan 1, 2013
228.838
+3.224
1.43%
Ranking of countries by current statistics by years