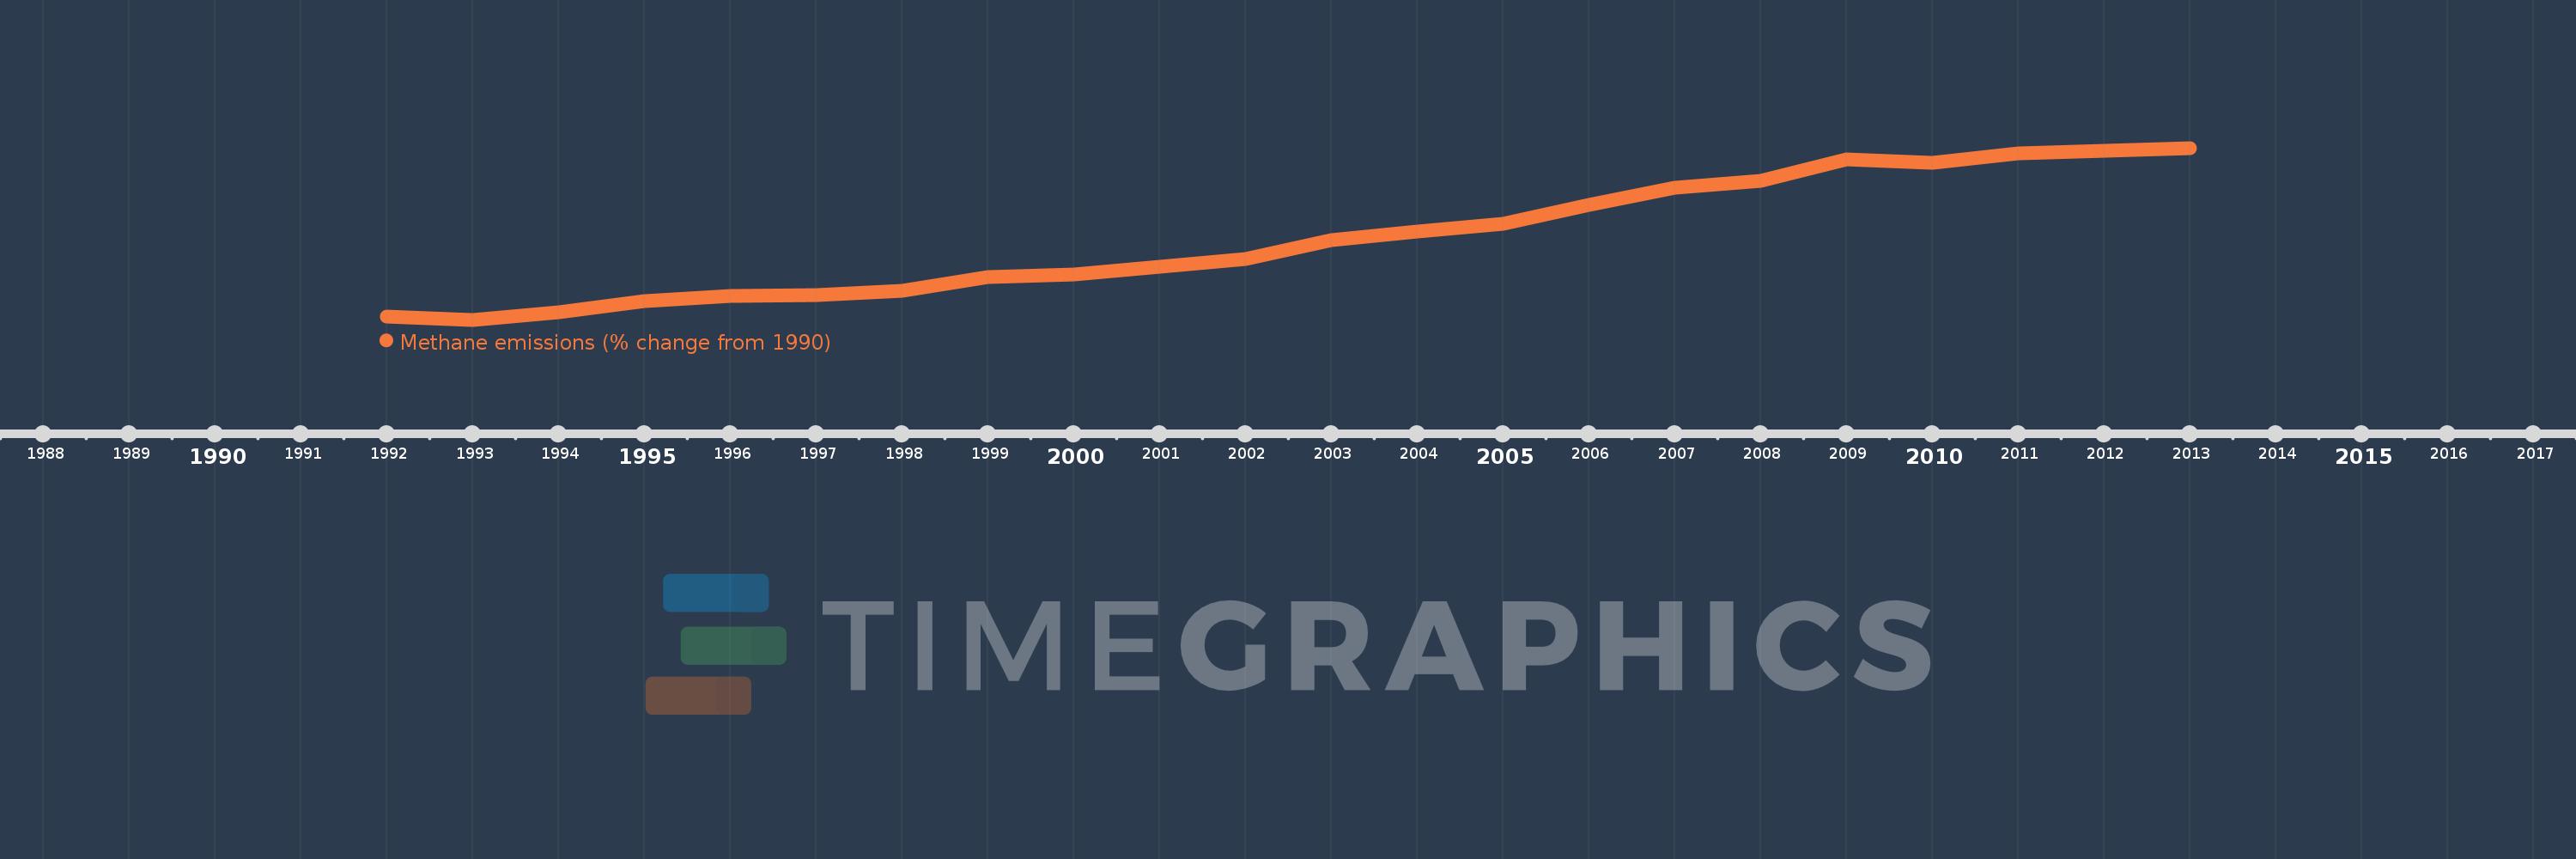
This timeline shows a graph from 1992 to 2013 of Uzbekistan. No data until 1991. Number of actual observations by date: 22.
Source name:
World Development Indicators
Source organization:
World Bank staff estimates from original source: European Commission, Joint Research Centre (JRC)/Netherlands Environmental Assessment Agency (PBL). Emission Database for Global Atmospheric Research (EDGAR): http://edgar.jrc.ec.europa.eu/.
Categories, topics:
Climate Change, Environment
Last updated:
apr 23, 2017
Indicators value changes by year
Meaning:
20.25
Minimum:
-0.653
jan 1, 1993
Maximum:
43.671
jan 1, 2013
At the date of observation
Value
Absolute change
Change from the previous value
jan 1, 1992
0.115
+0.115
0.0%
jan 1, 1993
-0.653
-0.767
-668.78%
jan 1, 1994
1.248
+1.9
-291.21%
jan 1, 1995
4.202
+2.954
236.73%
jan 1, 1996
5.58
+1.378
32.79%
jan 1, 1997
5.733
+0.154
2.75%
jan 1, 1998
6.782
+1.049
18.29%
jan 1, 1999
10.324
+3.542
52.23%
jan 1, 2000
10.951
+0.627
6.07%
jan 1, 2001
13.015
+2.064
18.85%
jan 1, 2002
15.058
+2.043
15.7%
jan 1, 2003
19.88
+4.822
32.02%
jan 1, 2004
22.145
+2.265
11.39%
jan 1, 2005
24.212
+2.067
9.34%
jan 1, 2006
28.902
+4.69
19.37%
jan 1, 2007
33.389
+4.486
15.52%
jan 1, 2008
35.083
+1.694
5.07%
jan 1, 2009
40.826
+5.744
16.37%
jan 1, 2010
39.845
-0.981
-2.4%
jan 1, 2011
42.24
+2.394
6.01%
jan 1, 2012
42.955
+0.716
1.69%
jan 1, 2013
43.671
+0.716
1.67%
Ranking of countries by current statistics by years