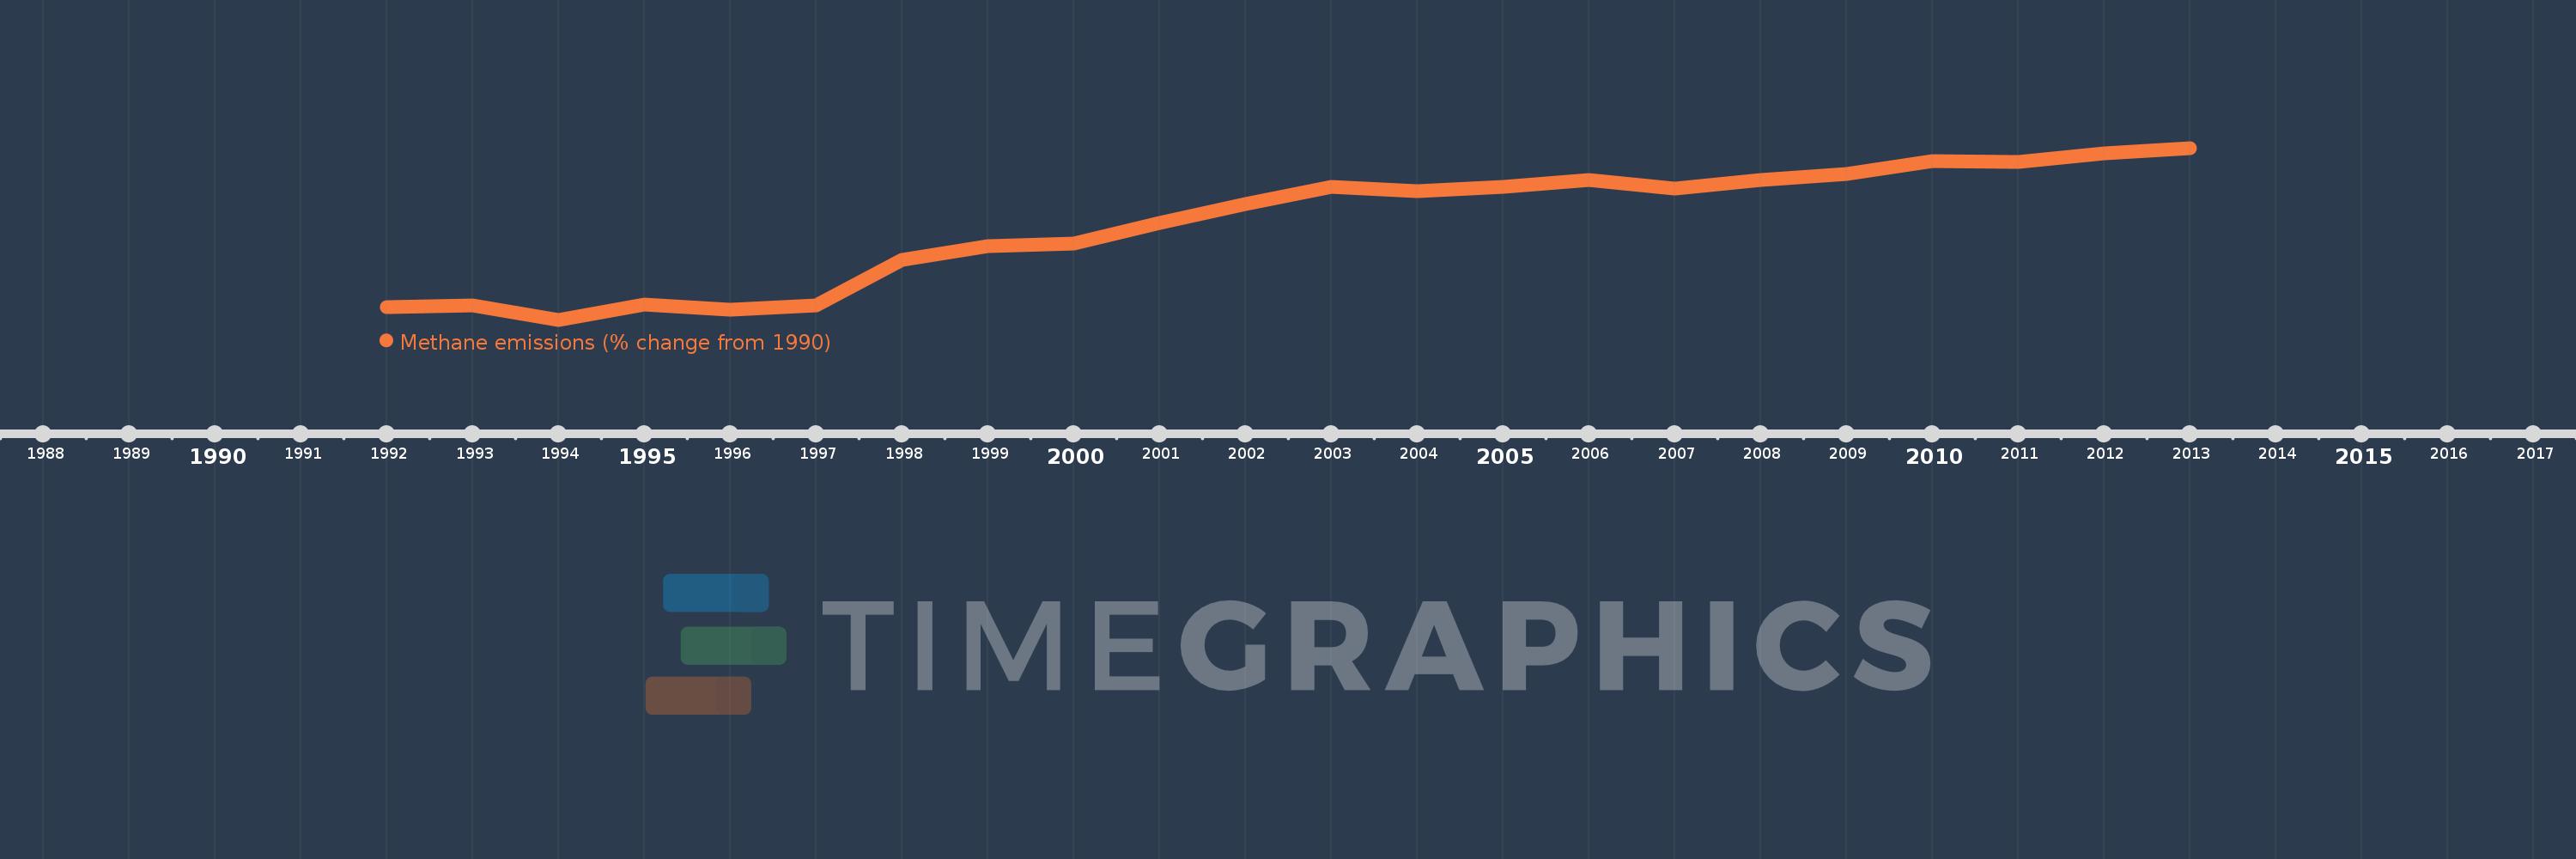
This timeline shows a graph from 1992 to 2013 of Spain. No data until 1991. Number of actual observations by date: 22.
Source name:
World Development Indicators
Source organization:
World Bank staff estimates from original source: European Commission, Joint Research Centre (JRC)/Netherlands Environmental Assessment Agency (PBL). Emission Database for Global Atmospheric Research (EDGAR): http://edgar.jrc.ec.europa.eu/.
Categories, topics:
Climate Change, Environment
Last updated:
apr 23, 2017
Indicators value changes by year
Meaning:
6.863
Minimum:
-1.283
jan 1, 1994
Maximum:
13.408
jan 1, 2013
At the date of observation
Value
Absolute change
Change from the previous value
jan 1, 1992
-0.172
-0.172
0.0%
jan 1, 1993
-0.026
+0.147
-85.13%
jan 1, 1994
-1.283
-1.258
4.91K%
jan 1, 1995
0.012
+1.296
-100.97%
jan 1, 1996
-0.425
-0.437
-3.5K%
jan 1, 1997
-0.086
+0.339
-79.77%
jan 1, 1998
3.839
+3.925
-4.57K%
jan 1, 1999
4.993
+1.154
30.07%
jan 1, 2000
5.215
+0.222
4.44%
jan 1, 2001
7.024
+1.81
34.7%
jan 1, 2002
8.596
+1.572
22.38%
jan 1, 2003
10.096
+1.5
17.45%
jan 1, 2004
9.716
-0.381
-3.77%
jan 1, 2005
10.113
+0.398
4.09%
jan 1, 2006
10.686
+0.572
5.66%
jan 1, 2007
9.949
-0.737
-6.9%
jan 1, 2008
10.647
+0.698
7.02%
jan 1, 2009
11.202
+0.555
5.21%
jan 1, 2010
12.274
+1.072
9.57%
jan 1, 2011
12.236
-0.038
-0.31%
jan 1, 2012
12.969
+0.733
5.99%
jan 1, 2013
13.408
+0.439
3.38%
Ranking of countries by current statistics by years