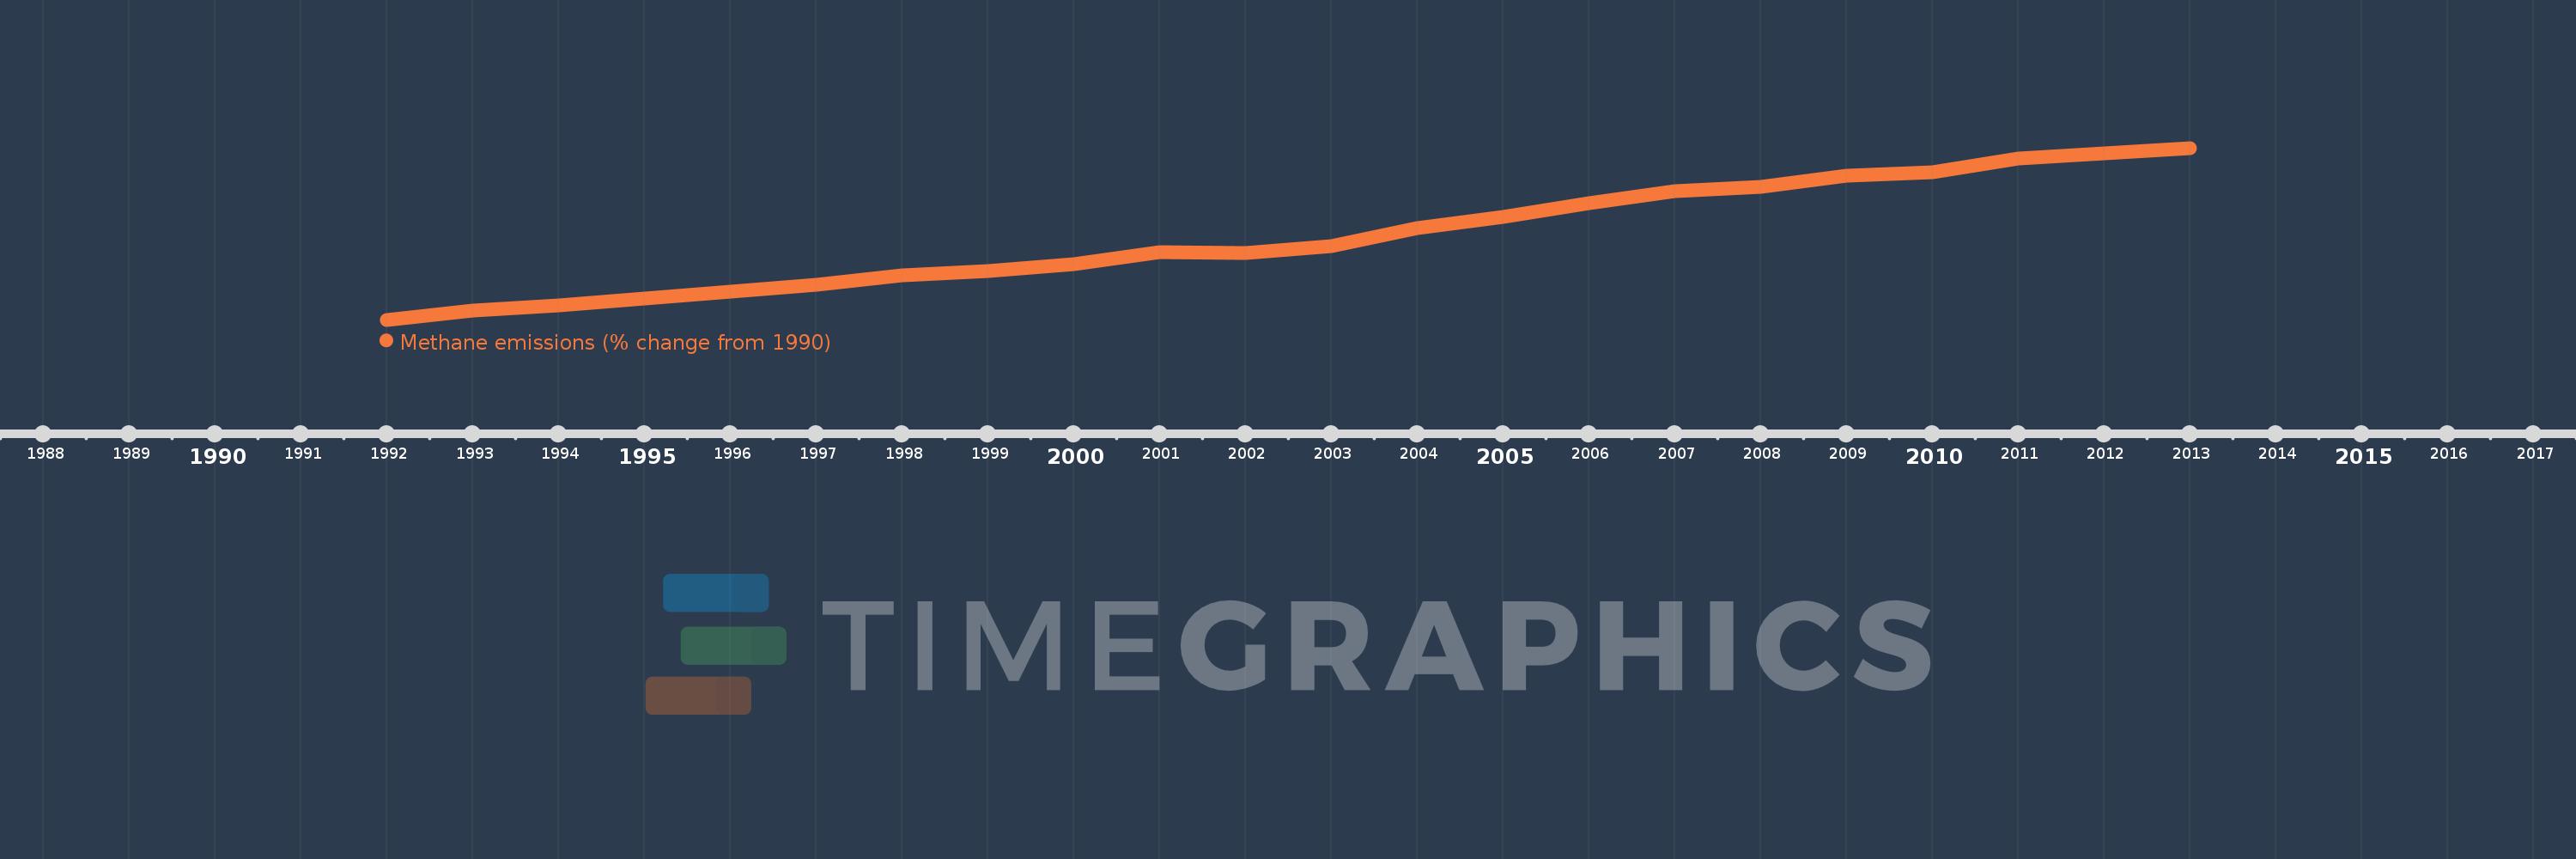
This timeline shows a graph from 1992 to 2013 of Middle East & North Africa. No data until 1991. Number of actual observations by date: 22.
Source name:
World Development Indicators
Source organization:
World Bank staff estimates from original source: European Commission, Joint Research Centre (JRC)/Netherlands Environmental Assessment Agency (PBL). Emission Database for Global Atmospheric Research (EDGAR): http://edgar.jrc.ec.europa.eu/.
Categories, topics:
Climate Change, Environment
Last updated:
apr 23, 2017
Indicators value changes by year
Meaning:
45.278
Minimum:
-0.026
jan 1, 1992
Maximum:
93.699
jan 1, 2013
At the date of observation
Value
Absolute change
Change from the previous value
jan 1, 1992
-0.026
-0.026
0.0%
jan 1, 1993
5.066
+5.092
-19.84K%
jan 1, 1994
7.617
+2.551
50.36%
jan 1, 1995
11.515
+3.897
51.17%
jan 1, 1996
15.338
+3.823
33.2%
jan 1, 1997
19.048
+3.711
24.19%
jan 1, 1998
24.119
+5.07
26.62%
jan 1, 1999
26.362
+2.243
9.3%
jan 1, 2000
30.215
+3.853
14.62%
jan 1, 2001
37.05
+6.835
22.62%
jan 1, 2002
36.542
-0.507
-1.37%
jan 1, 2003
39.968
+3.425
9.37%
jan 1, 2004
49.862
+9.894
24.76%
jan 1, 2005
56.263
+6.402
12.84%
jan 1, 2006
63.475
+7.212
12.82%
jan 1, 2007
69.905
+6.43
10.13%
jan 1, 2008
72.428
+2.523
3.61%
jan 1, 2009
78.527
+6.1
8.42%
jan 1, 2010
80.419
+1.892
2.41%
jan 1, 2011
87.917
+7.498
9.32%
jan 1, 2012
90.808
+2.891
3.29%
jan 1, 2013
93.699
+2.891
3.18%
Ranking of countries by current statistics by years