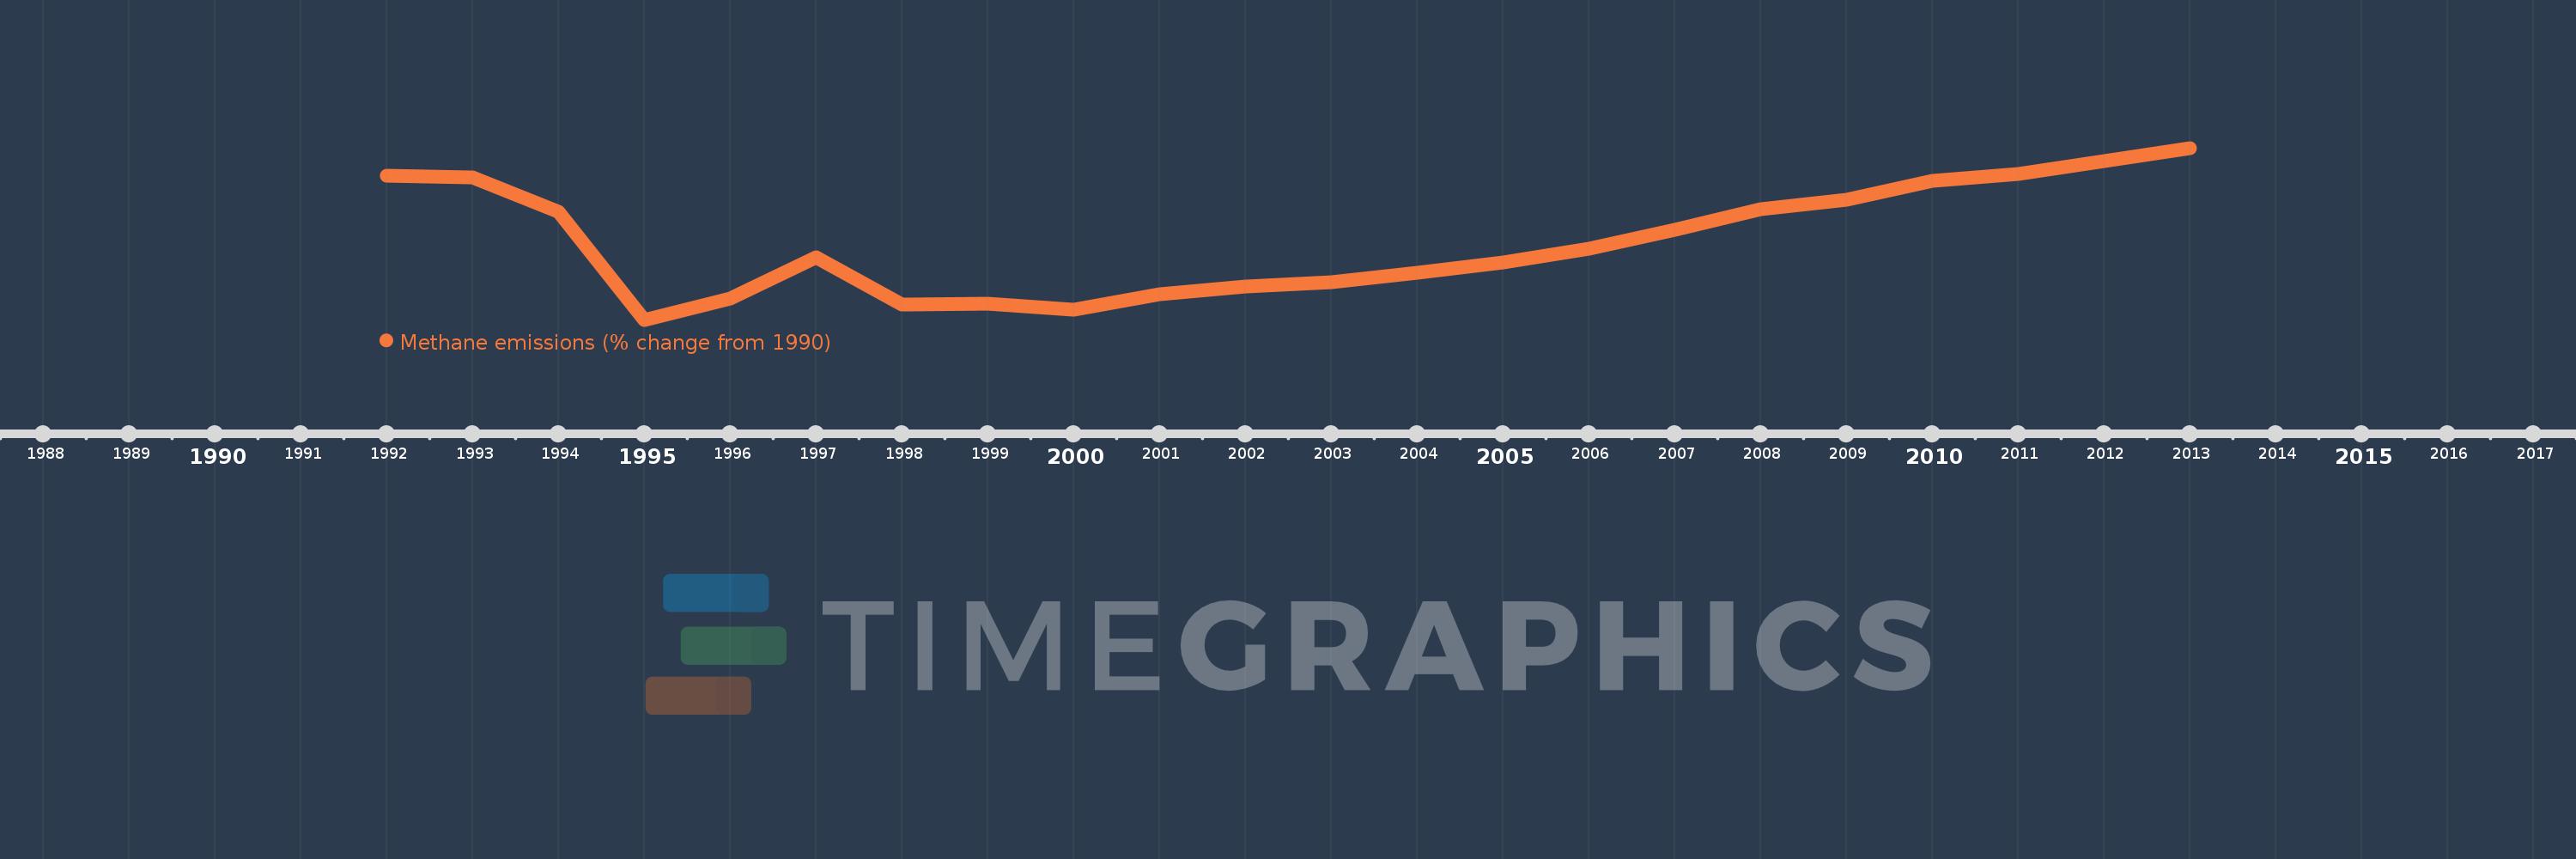
This timeline shows a graph from 1992 to 2013 of Georgia. No data until 1991. Number of actual observations by date: 22.
Source name:
World Development Indicators
Source organization:
World Bank staff estimates from original source: European Commission, Joint Research Centre (JRC)/Netherlands Environmental Assessment Agency (PBL). Emission Database for Global Atmospheric Research (EDGAR): http://edgar.jrc.ec.europa.eu/.
Categories, topics:
Climate Change, Environment
Last updated:
apr 23, 2017
Indicators value changes by year
Meaning:
-11.453
Minimum:
-20.825
jan 1, 1995
Maximum:
-0.319
jan 1, 2013
At the date of observation
Value
Absolute change
Change from the previous value
jan 1, 1992
-3.666
-3.666
0.0%
jan 1, 1993
-3.844
-0.178
4.85%
jan 1, 1994
-7.898
-4.054
105.48%
jan 1, 1995
-20.825
-12.927
163.67%
jan 1, 1996
-18.251
+2.574
-12.36%
jan 1, 1997
-13.356
+4.895
-26.82%
jan 1, 1998
-18.96
-5.604
41.96%
jan 1, 1999
-18.865
+0.095
-0.5%
jan 1, 2000
-19.637
-0.772
4.09%
jan 1, 2001
-17.831
+1.807
-9.2%
jan 1, 2002
-16.868
+0.962
-5.4%
jan 1, 2003
-16.387
+0.481
-2.85%
jan 1, 2004
-15.199
+1.188
-7.25%
jan 1, 2005
-14.008
+1.191
-7.84%
jan 1, 2006
-12.355
+1.653
-11.8%
jan 1, 2007
-10.08
+2.275
-18.41%
jan 1, 2008
-7.584
+2.496
-24.76%
jan 1, 2009
-6.494
+1.09
-14.37%
jan 1, 2010
-4.245
+2.25
-34.64%
jan 1, 2011
-3.429
+0.816
-19.23%
jan 1, 2012
-1.874
+1.555
-45.36%
jan 1, 2013
-0.319
+1.555
-83.0%
Ranking of countries by current statistics by years