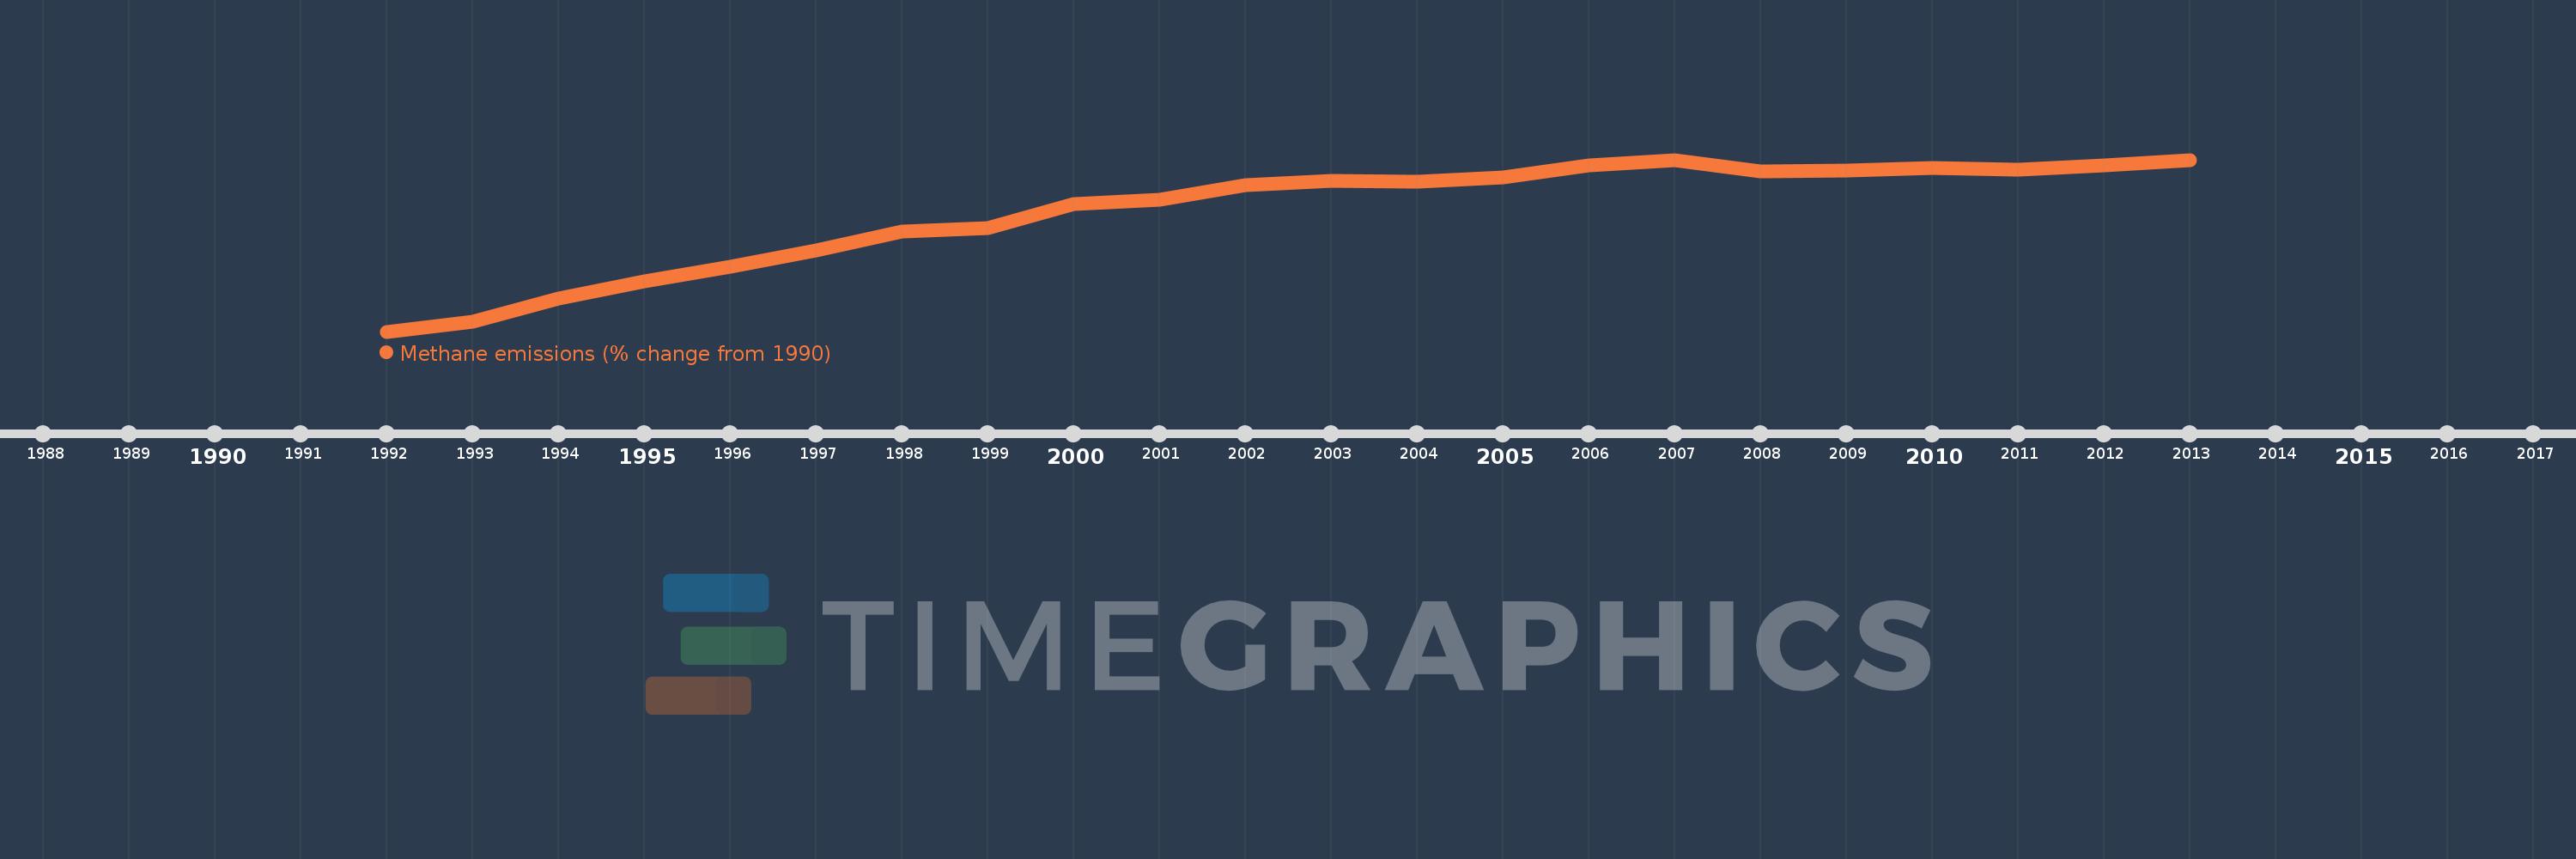
This timeline shows a graph from 1992 to 2013 of Chile. No data until 1991. Number of actual observations by date: 22.
Source name:
World Development Indicators
Source organization:
World Bank staff estimates from original source: European Commission, Joint Research Centre (JRC)/Netherlands Environmental Assessment Agency (PBL). Emission Database for Global Atmospheric Research (EDGAR): http://edgar.jrc.ec.europa.eu/.
Categories, topics:
Climate Change, Environment
Last updated:
apr 23, 2017
Indicators value changes by year
Meaning:
37.514
Minimum:
1.345
jan 1, 1992
Maximum:
53.392
jan 1, 2007
At the date of observation
Value
Absolute change
Change from the previous value
jan 1, 1992
1.345
+1.345
0.0%
jan 1, 1993
4.311
+2.965
220.4%
jan 1, 1994
11.385
+7.074
164.11%
jan 1, 1995
16.516
+5.131
45.07%
jan 1, 1996
20.966
+4.45
26.94%
jan 1, 1997
26.016
+5.05
24.09%
jan 1, 1998
31.697
+5.681
21.84%
jan 1, 1999
32.693
+0.996
3.14%
jan 1, 2000
39.983
+7.29
22.3%
jan 1, 2001
41.209
+1.225
3.06%
jan 1, 2002
45.762
+4.554
11.05%
jan 1, 2003
46.989
+1.227
2.68%
jan 1, 2004
46.746
-0.244
-0.52%
jan 1, 2005
48.019
+1.274
2.72%
jan 1, 2006
51.784
+3.764
7.84%
jan 1, 2007
53.392
+1.608
3.11%
jan 1, 2008
49.914
-3.478
-6.51%
jan 1, 2009
50.102
+0.189
0.38%
jan 1, 2010
51.036
+0.933
1.86%
jan 1, 2011
50.312
-0.724
-1.42%
jan 1, 2012
51.815
+1.503
2.99%
jan 1, 2013
53.318
+1.503
2.9%
Ranking of countries by current statistics by years