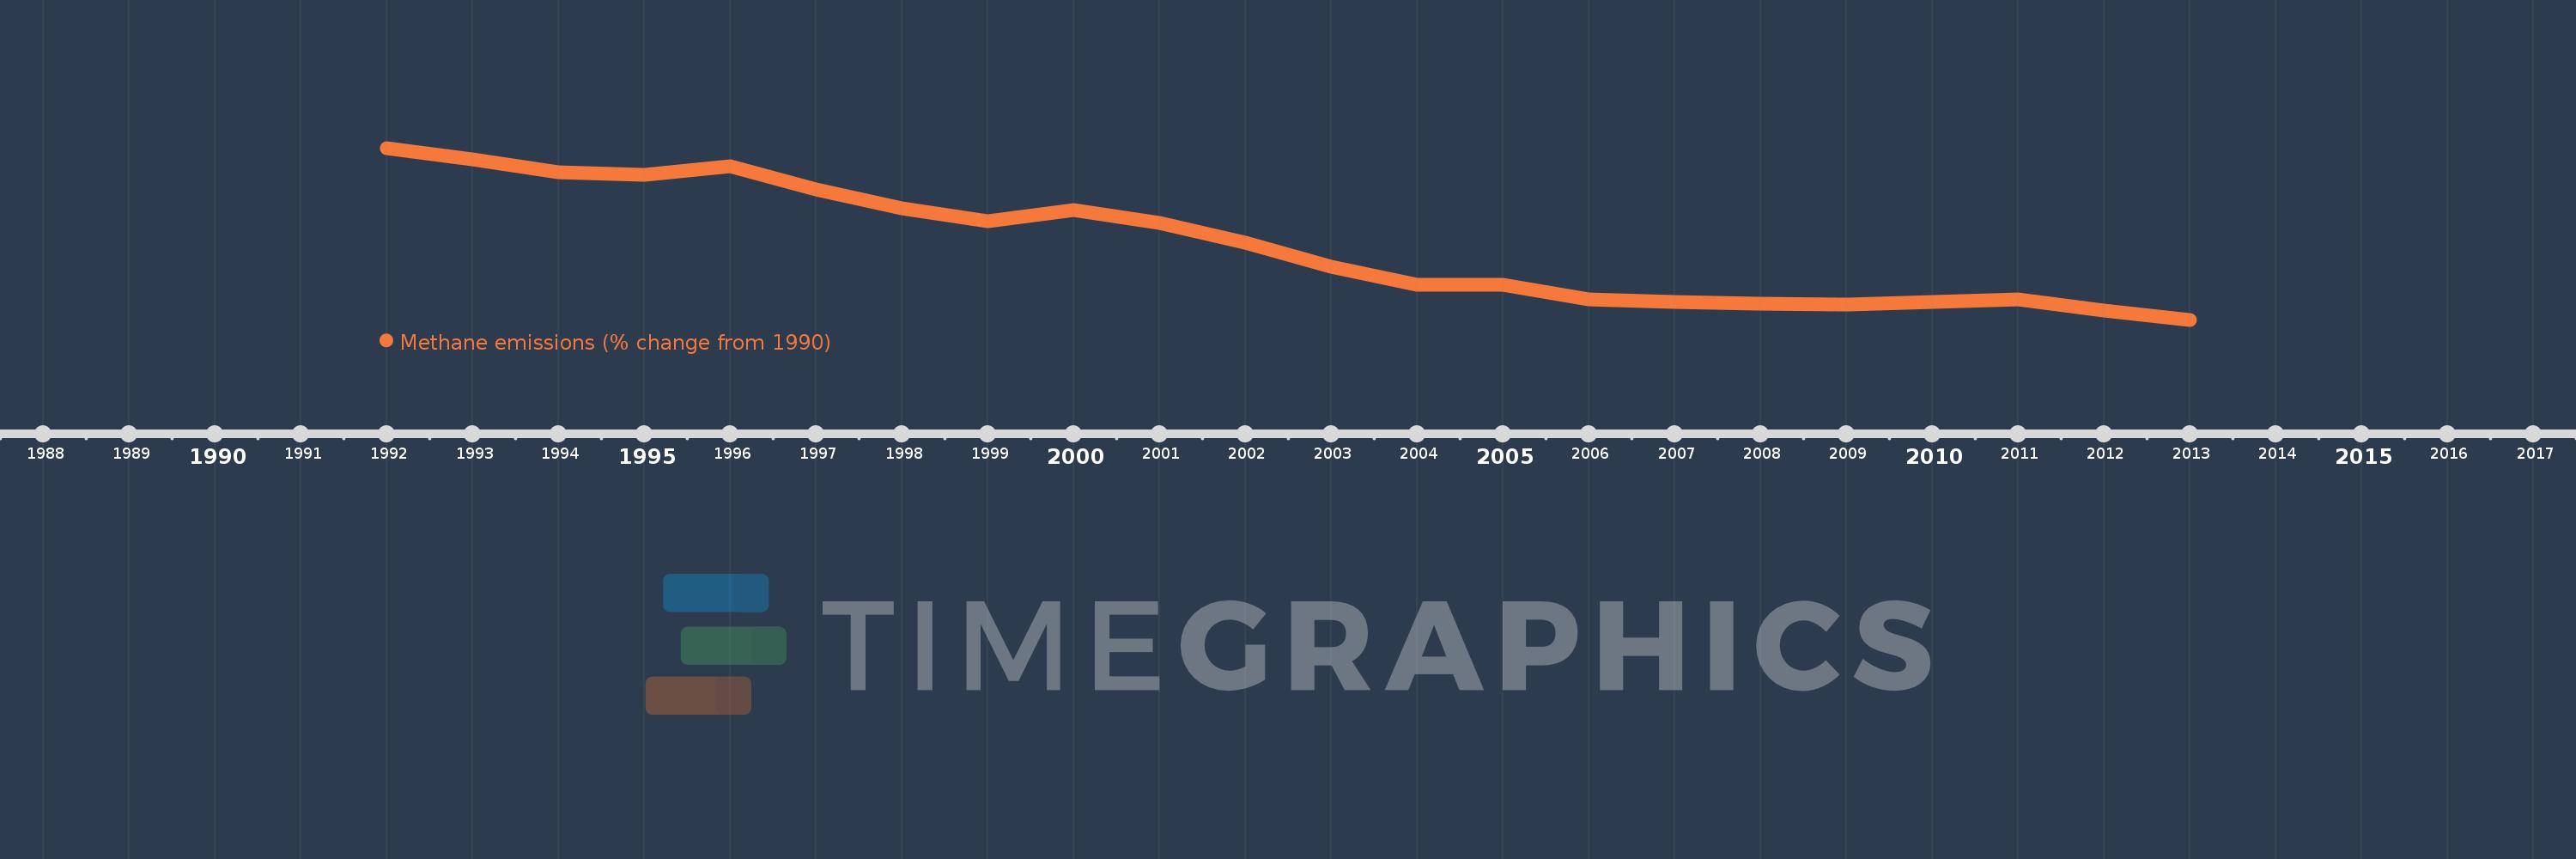
This timeline shows a graph from 1992 to 2013 of Belgium. No data until 1991. Number of actual observations by date: 22.
Source name:
World Development Indicators
Source organization:
World Bank staff estimates from original source: European Commission, Joint Research Centre (JRC)/Netherlands Environmental Assessment Agency (PBL). Emission Database for Global Atmospheric Research (EDGAR): http://edgar.jrc.ec.europa.eu/.
Categories, topics:
Climate Change, Environment
Last updated:
apr 23, 2017
Indicators value changes by year
Meaning:
-14.322
Minimum:
-25.726
jan 1, 2013
Maximum:
0.538
jan 1, 1992
At the date of observation
Value
Absolute change
Change from the previous value
jan 1, 1992
0.538
+0.538
0.0%
jan 1, 1993
-1.183
-1.721
-319.7%
jan 1, 1994
-3.147
-1.965
166.1%
jan 1, 1995
-3.519
-0.372
11.82%
jan 1, 1996
-2.309
+1.211
-34.41%
jan 1, 1997
-5.859
-3.551
153.81%
jan 1, 1998
-8.655
-2.796
47.71%
jan 1, 1999
-10.702
-2.047
23.66%
jan 1, 2000
-9.018
+1.684
-15.74%
jan 1, 2001
-10.976
-1.958
21.71%
jan 1, 2002
-13.942
-2.966
27.02%
jan 1, 2003
-17.637
-3.695
26.5%
jan 1, 2004
-20.318
-2.681
15.2%
jan 1, 2005
-20.401
-0.083
0.41%
jan 1, 2006
-22.67
-2.269
11.12%
jan 1, 2007
-22.988
-0.318
1.4%
jan 1, 2008
-23.284
-0.296
1.29%
jan 1, 2009
-23.36
-0.076
0.32%
jan 1, 2010
-22.972
+0.387
-1.66%
jan 1, 2011
-22.601
+0.372
-1.62%
jan 1, 2012
-24.349
-1.749
7.74%
jan 1, 2013
-25.726
-1.377
5.66%
Ranking of countries by current statistics by years