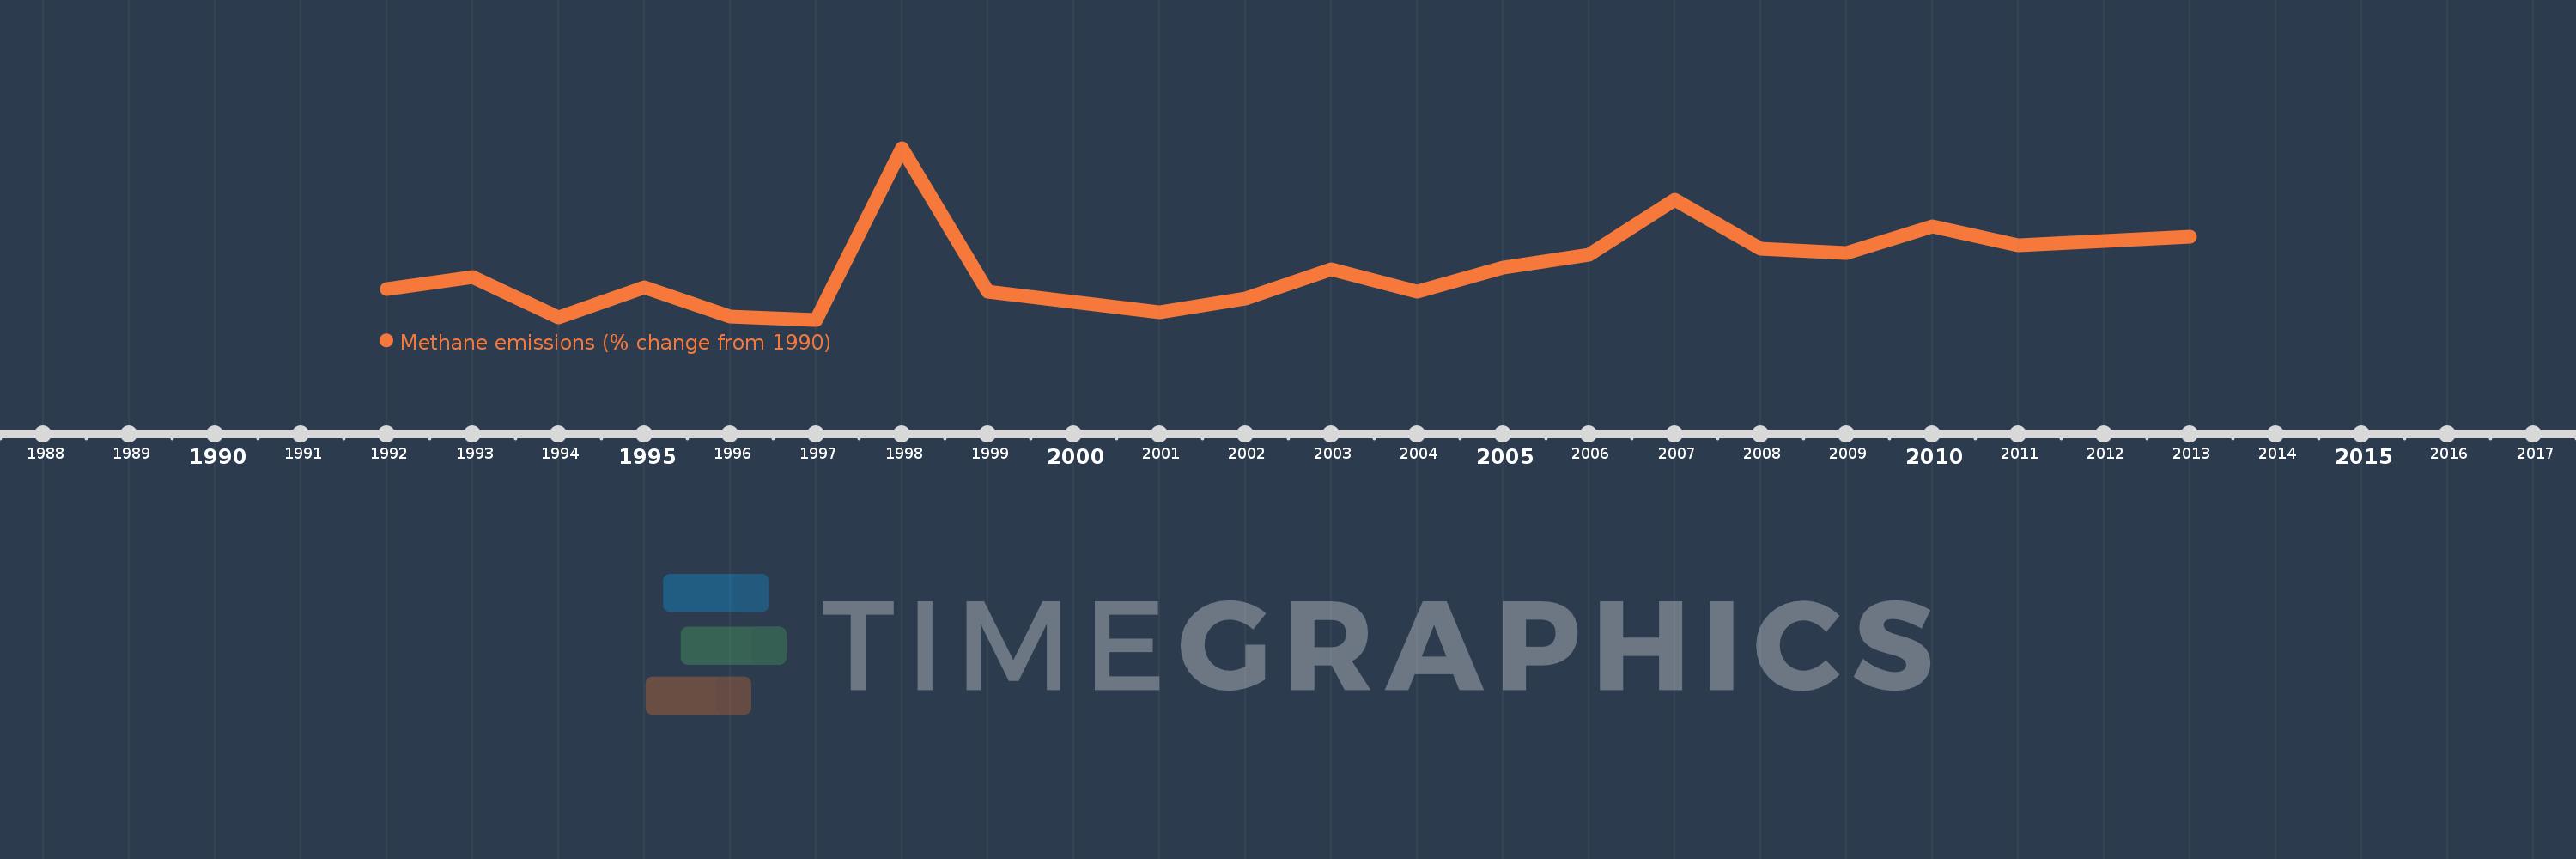
This timeline shows a graph from 1992 to 2013 of Lower middle income. No data until 1991. Number of actual observations by date: 22.
Source name:
World Development Indicators
Source organization:
World Bank staff estimates from original source: European Commission, Joint Research Centre (JRC)/Netherlands Environmental Assessment Agency (PBL). Emission Database for Global Atmospheric Research (EDGAR): http://edgar.jrc.ec.europa.eu/.
Categories, topics:
Climate Change, Environment
Last updated:
apr 23, 2017
Indicators value changes by year
Meaning:
15.596
Minimum:
1.724
jan 1, 1997
Maximum:
47.661
jan 1, 1998
At the date of observation
Value
Absolute change
Change from the previous value
jan 1, 1992
9.935
+9.935
0.0%
jan 1, 1993
13.146
+3.212
32.33%
jan 1, 1994
2.38
-10.766
-81.9%
jan 1, 1995
10.397
+8.017
336.82%
jan 1, 1996
2.526
-7.871
-75.7%
jan 1, 1997
1.724
-0.802
-31.73%
jan 1, 1998
47.661
+45.937
2.66K%
jan 1, 1999
9.138
-38.523
-80.83%
jan 1, 2000
6.408
-2.729
-29.87%
jan 1, 2001
3.788
-2.62
-40.88%
jan 1, 2002
7.505
+3.716
98.09%
jan 1, 2003
15.218
+7.714
102.79%
jan 1, 2004
9.248
-5.97
-39.23%
jan 1, 2005
15.775
+6.526
70.57%
jan 1, 2006
19.117
+3.343
21.19%
jan 1, 2007
33.919
+14.802
77.42%
jan 1, 2008
20.697
-13.222
-38.98%
jan 1, 2009
19.529
-1.168
-5.64%
jan 1, 2010
26.651
+7.122
36.47%
jan 1, 2011
21.534
-5.116
-19.2%
jan 1, 2012
22.781
+1.247
5.79%
jan 1, 2013
24.028
+1.247
5.47%
Ranking of countries by current statistics by years