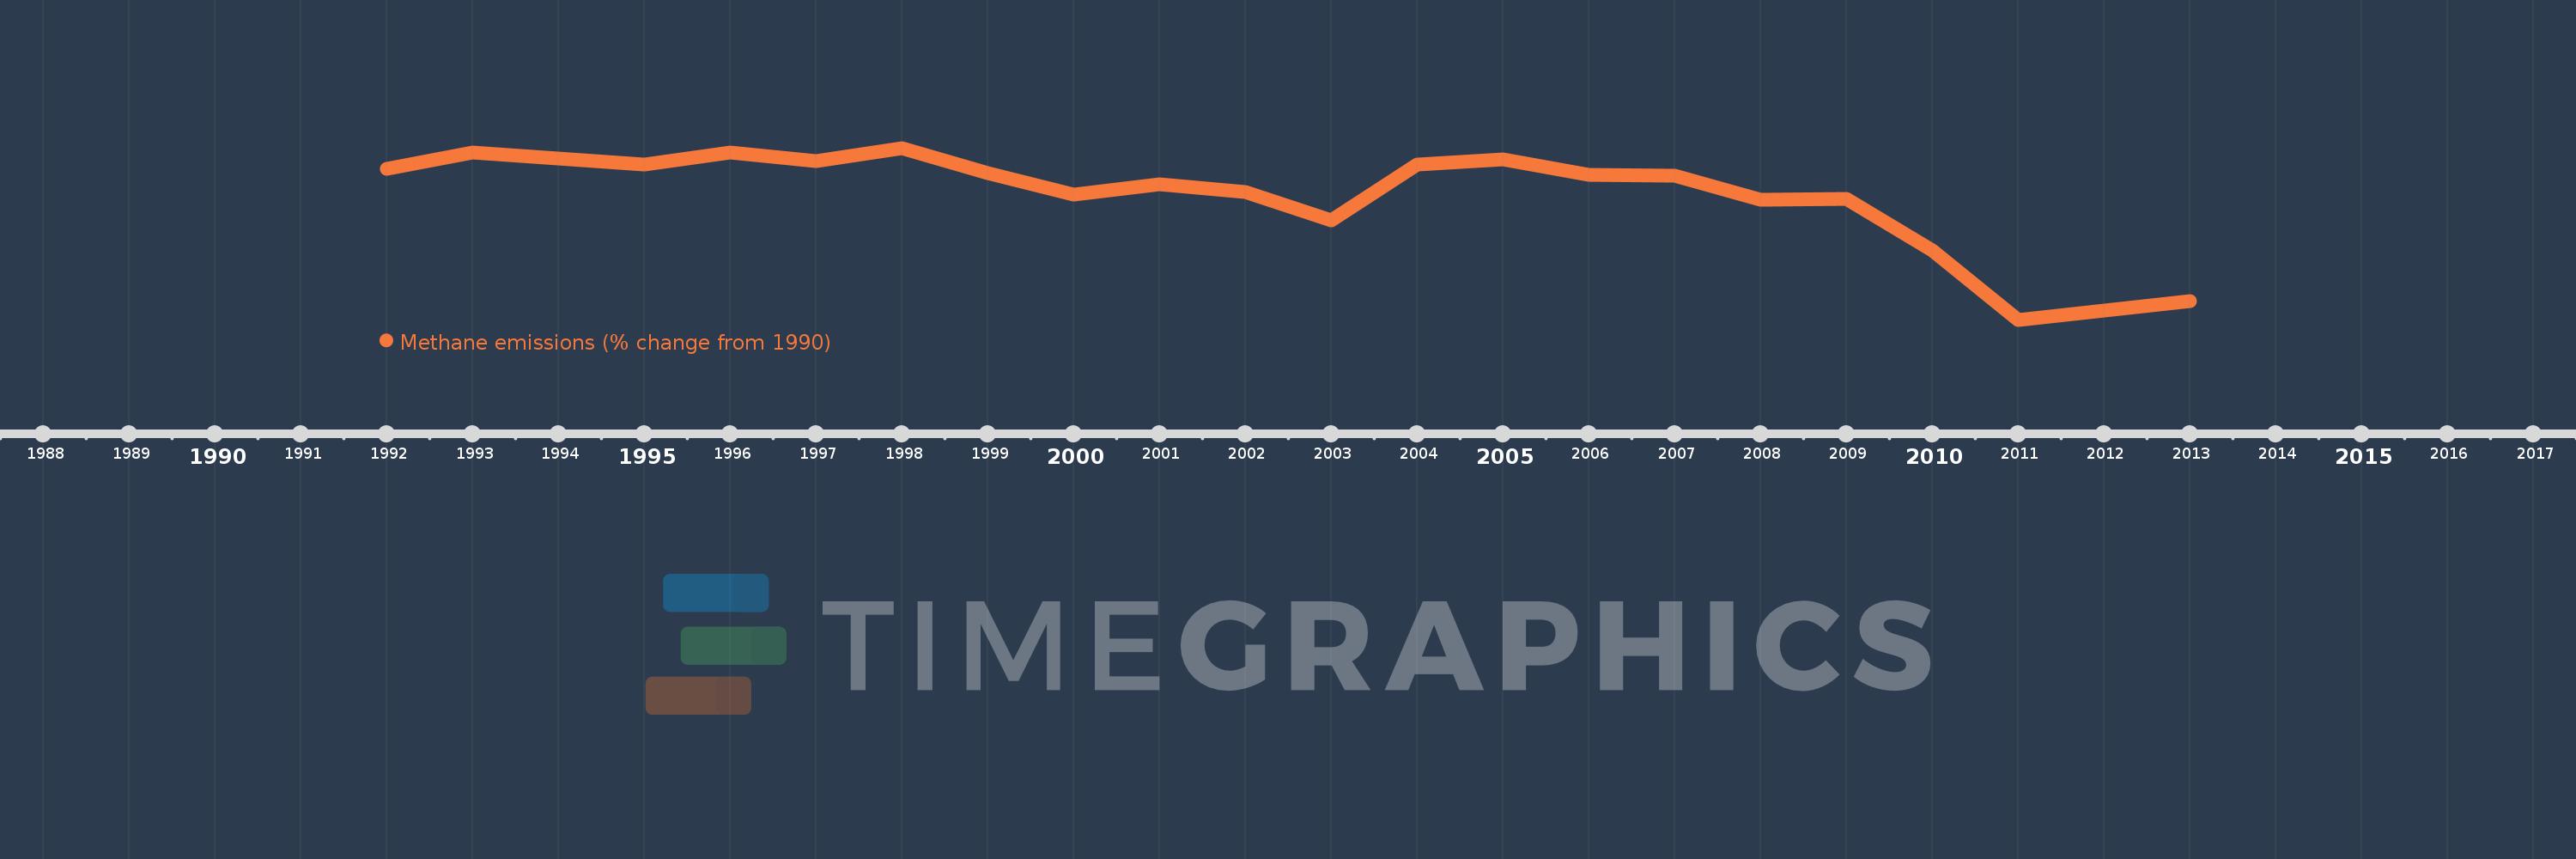
This timeline shows a graph from 1992 to 2013 of Argentina. No data until 1991. Number of actual observations by date: 22.
Source name:
World Development Indicators
Source organization:
World Bank staff estimates from original source: European Commission, Joint Research Centre (JRC)/Netherlands Environmental Assessment Agency (PBL). Emission Database for Global Atmospheric Research (EDGAR): http://edgar.jrc.ec.europa.eu/.
Categories, topics:
Climate Change, Environment
Last updated:
apr 23, 2017
Indicators value changes by year
Meaning:
-3.905
Minimum:
-15.028
jan 1, 2011
Maximum:
0.484
jan 1, 1998
At the date of observation
Value
Absolute change
Change from the previous value
jan 1, 1992
-1.406
-1.406
0.0%
jan 1, 1993
0.062
+1.467
-104.39%
jan 1, 1994
-0.504
-0.566
-917.46%
jan 1, 1995
-0.993
-0.489
96.89%
jan 1, 1996
0.11
+1.103
-111.05%
jan 1, 1997
-0.669
-0.779
-709.82%
jan 1, 1998
0.484
+1.153
-172.33%
jan 1, 1999
-1.777
-2.261
-467.21%
jan 1, 2000
-3.705
-1.928
108.47%
jan 1, 2001
-2.81
+0.894
-24.14%
jan 1, 2002
-3.495
-0.685
24.36%
jan 1, 2003
-6.063
-2.568
73.48%
jan 1, 2004
-0.996
+5.067
-83.57%
jan 1, 2005
-0.57
+0.426
-42.77%
jan 1, 2006
-1.917
-1.347
236.25%
jan 1, 2007
-2.016
-0.099
5.16%
jan 1, 2008
-4.212
-2.196
108.91%
jan 1, 2009
-4.101
+0.111
-2.63%
jan 1, 2010
-8.787
-4.686
114.26%
jan 1, 2011
-15.028
-6.242
71.03%
jan 1, 2012
-14.179
+0.85
-5.65%
jan 1, 2013
-13.329
+0.85
-5.99%
Ranking of countries by current statistics by years