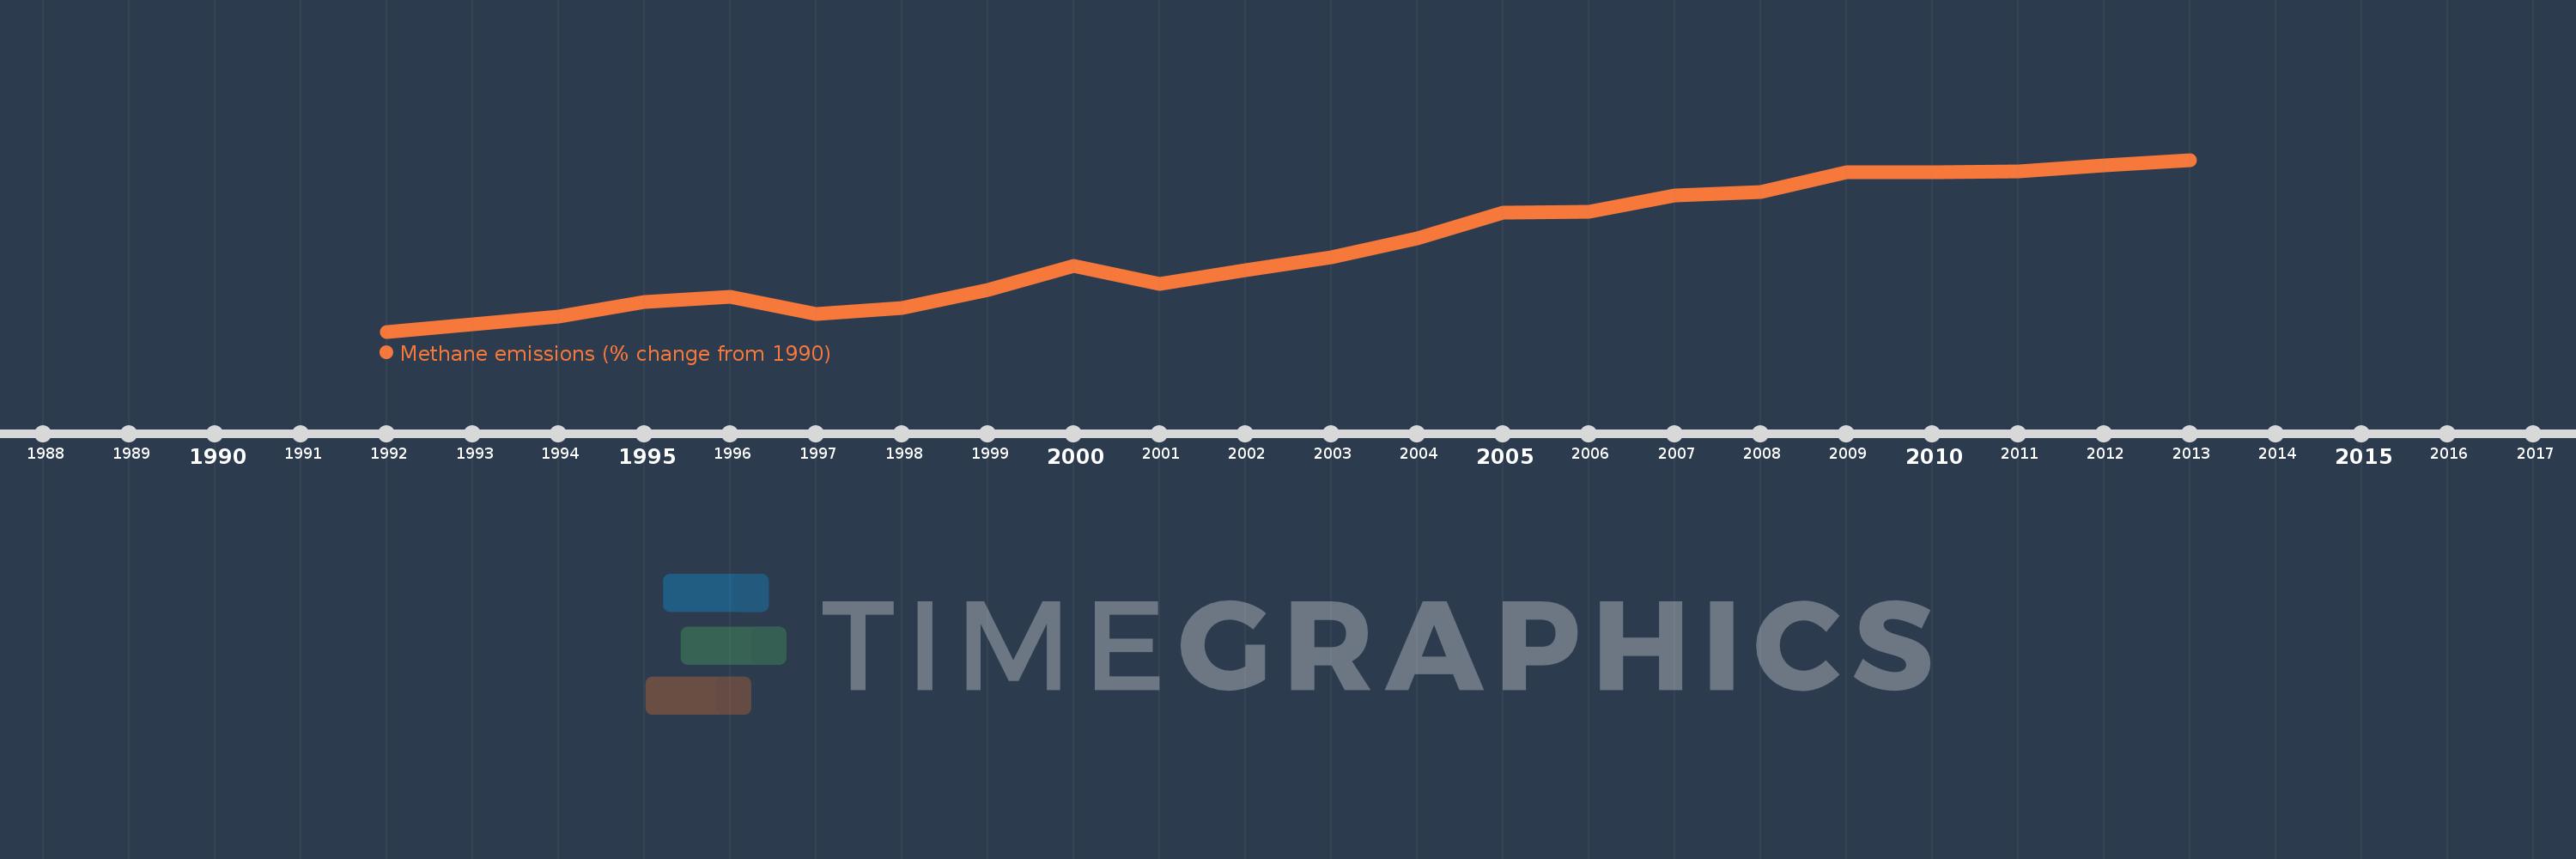
This timeline shows a graph from 1992 to 2013 of Kenya. No data until 1991. Number of actual observations by date: 22.
Source name:
World Development Indicators
Source organization:
World Bank staff estimates from original source: European Commission, Joint Research Centre (JRC)/Netherlands Environmental Assessment Agency (PBL). Emission Database for Global Atmospheric Research (EDGAR): http://edgar.jrc.ec.europa.eu/.
Categories, topics:
Climate Change, Environment
Last updated:
apr 23, 2017
Indicators value changes by year
Meaning:
17.828
Minimum:
-1.263
jan 1, 1992
Maximum:
37.898
jan 1, 2013
At the date of observation
Value
Absolute change
Change from the previous value
jan 1, 1992
-1.263
-1.263
0.0%
jan 1, 1993
0.338
+1.601
-126.76%
jan 1, 1994
2.228
+1.89
559.1%
jan 1, 1995
5.434
+3.207
143.93%
jan 1, 1996
6.654
+1.22
22.44%
jan 1, 1997
2.749
-3.905
-58.69%
jan 1, 1998
4.184
+1.435
52.21%
jan 1, 1999
8.175
+3.991
95.39%
jan 1, 2000
13.797
+5.622
68.77%
jan 1, 2001
9.638
-4.159
-30.14%
jan 1, 2002
12.661
+3.023
31.36%
jan 1, 2003
15.689
+3.028
23.91%
jan 1, 2004
19.924
+4.235
27.0%
jan 1, 2005
25.88
+5.955
29.89%
jan 1, 2006
26.03
+0.151
0.58%
jan 1, 2007
29.809
+3.779
14.52%
jan 1, 2008
30.605
+0.796
2.67%
jan 1, 2009
35.046
+4.44
14.51%
jan 1, 2010
34.994
-0.052
-0.15%
jan 1, 2011
35.194
+0.2
0.57%
jan 1, 2012
36.546
+1.352
3.84%
jan 1, 2013
37.898
+1.352
3.7%
Ranking of countries by current statistics by years