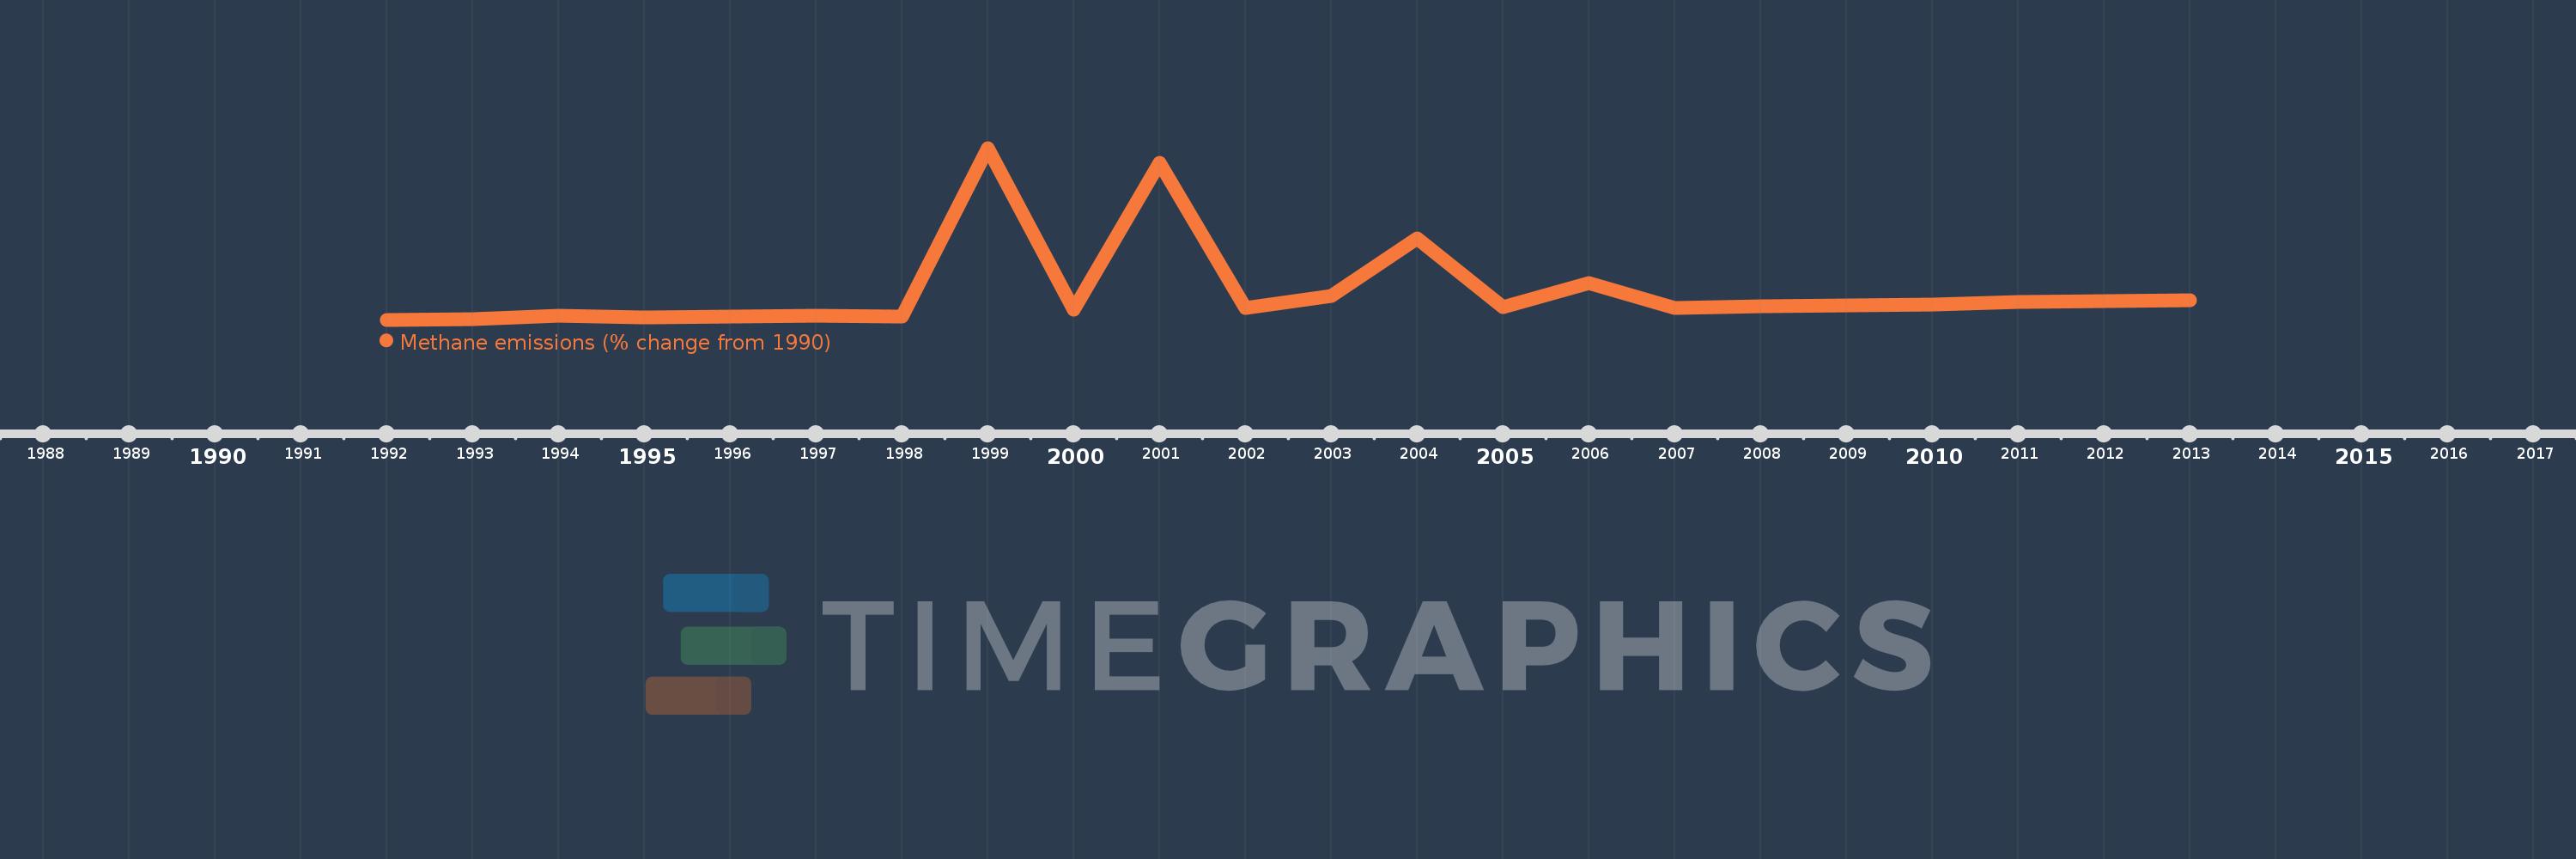
This timeline shows a graph from 1992 to 2013 of Guatemala. No data until 1991. Number of actual observations by date: 22.
Source name:
World Development Indicators
Source organization:
World Bank staff estimates from original source: European Commission, Joint Research Centre (JRC)/Netherlands Environmental Assessment Agency (PBL). Emission Database for Global Atmospheric Research (EDGAR): http://edgar.jrc.ec.europa.eu/.
Categories, topics:
Climate Change, Environment
Last updated:
apr 23, 2017
Indicators value changes by year
Meaning:
60.811
Minimum:
6.076
jan 1, 1992
Maximum:
332.351
jan 1, 1999
At the date of observation
Value
Absolute change
Change from the previous value
jan 1, 1992
6.076
+6.076
0.0%
jan 1, 1993
7.455
+1.38
22.71%
jan 1, 1994
14.12
+6.665
89.4%
jan 1, 1995
10.782
-3.338
-23.64%
jan 1, 1996
11.689
+0.907
8.42%
jan 1, 1997
14.066
+2.376
20.33%
jan 1, 1998
12.784
-1.282
-9.11%
jan 1, 1999
332.351
+319.567
2.5K%
jan 1, 2000
25.791
-306.56
-92.24%
jan 1, 2001
303.985
+278.194
1.08K%
jan 1, 2002
28.331
-275.654
-90.68%
jan 1, 2003
50.657
+22.327
78.81%
jan 1, 2004
161.097
+110.44
218.01%
jan 1, 2005
30.447
-130.65
-81.1%
jan 1, 2006
75.133
+44.686
146.77%
jan 1, 2007
28.73
-46.403
-61.76%
jan 1, 2008
31.723
+2.993
10.42%
jan 1, 2009
32.625
+0.902
2.84%
jan 1, 2010
34.24
+1.615
4.95%
jan 1, 2011
40.517
+6.277
18.33%
jan 1, 2012
41.922
+1.405
3.47%
jan 1, 2013
43.327
+1.405
3.35%
Ranking of countries by current statistics by years