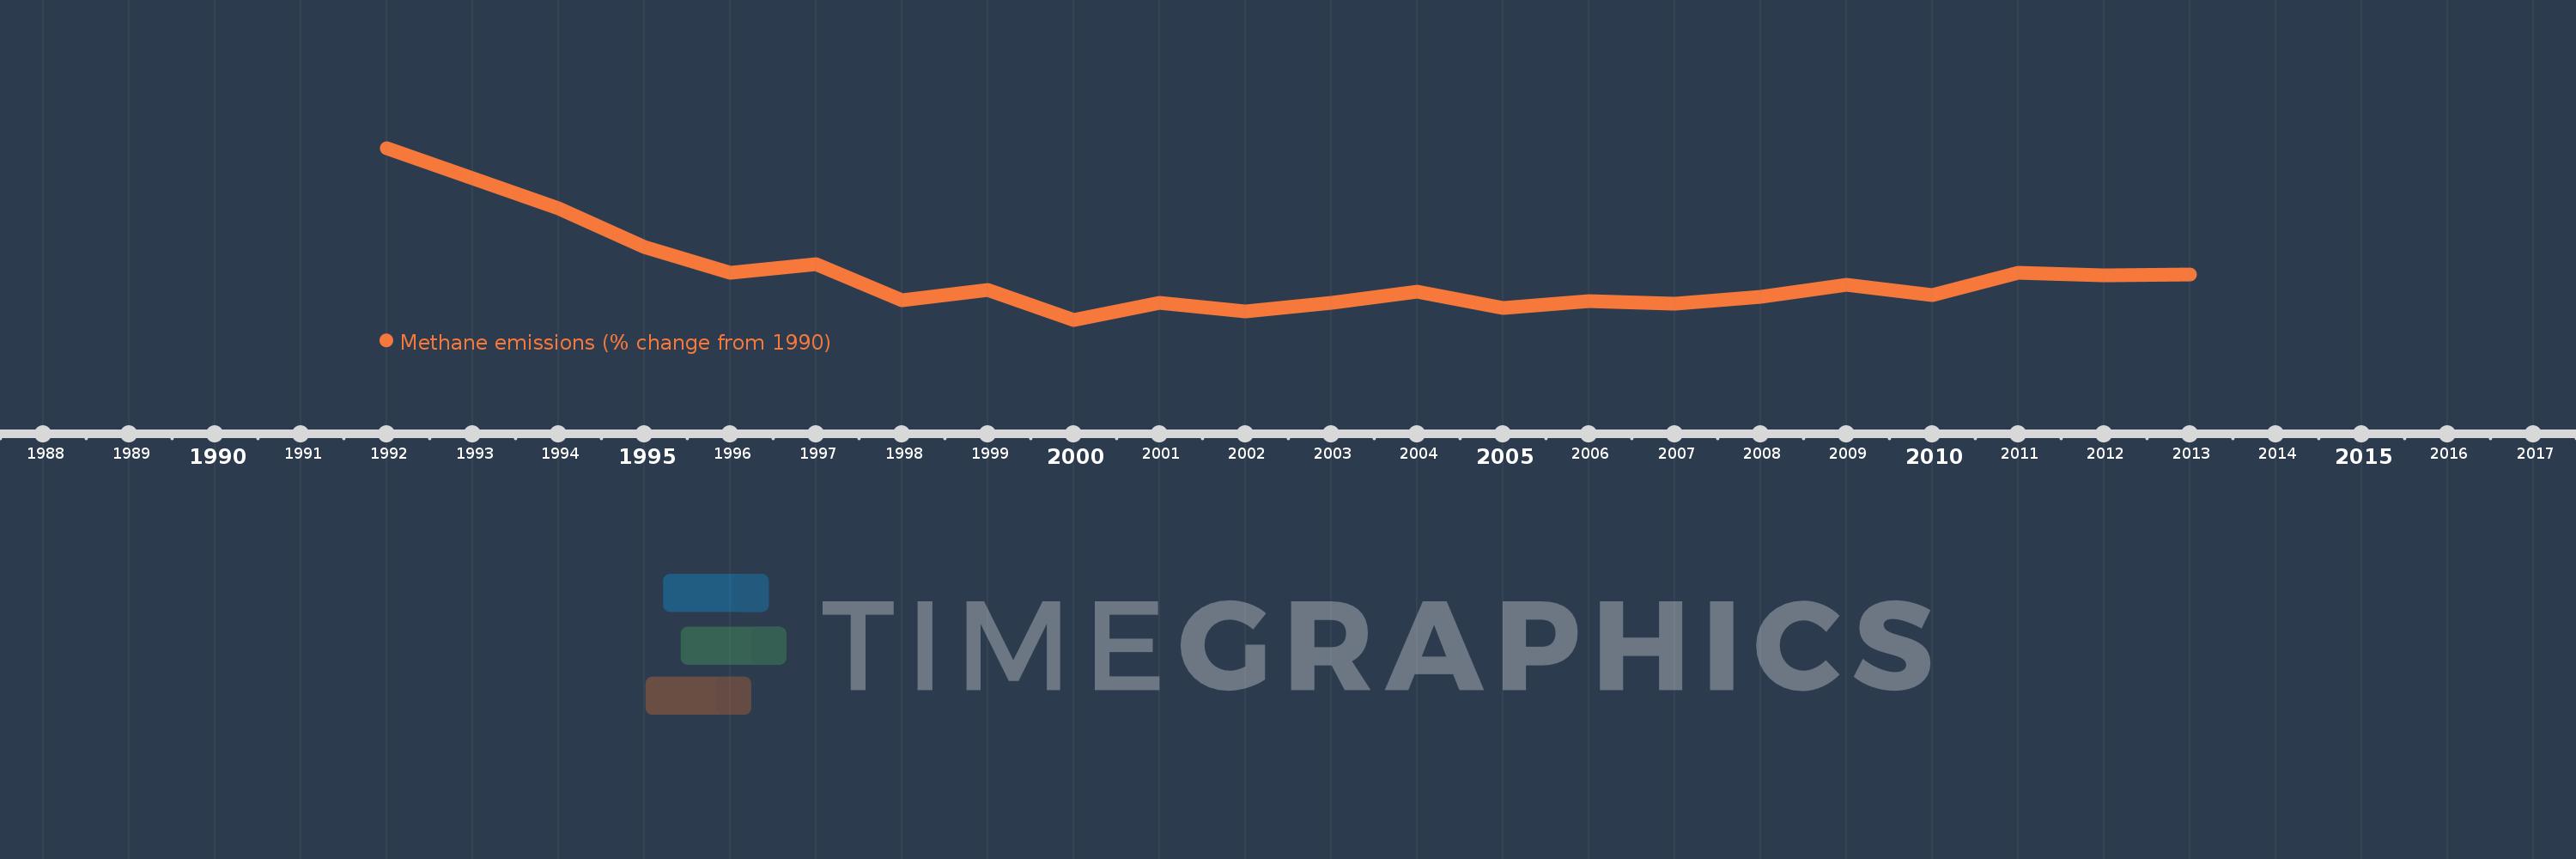
This timeline shows a graph from 1992 to 2013 of Europe & Central Asia. No data until 1991. Number of actual observations by date: 22.
Source name:
World Development Indicators
Source organization:
World Bank staff estimates from original source: European Commission, Joint Research Centre (JRC)/Netherlands Environmental Assessment Agency (PBL). Emission Database for Global Atmospheric Research (EDGAR): http://edgar.jrc.ec.europa.eu/.
Categories, topics:
Climate Change, Environment
Last updated:
apr 23, 2017
Indicators value changes by year
Meaning:
-17.699
Minimum:
-22.57
jan 1, 2000
Maximum:
-3.889
jan 1, 1992
At the date of observation
Value
Absolute change
Change from the previous value
jan 1, 1992
-3.889
-3.889
0.0%
jan 1, 1993
-7.151
-3.262
83.86%
jan 1, 1994
-10.449
-3.298
46.11%
jan 1, 1995
-14.647
-4.198
40.17%
jan 1, 1996
-17.456
-2.809
19.18%
jan 1, 1997
-16.518
+0.938
-5.37%
jan 1, 1998
-20.449
-3.931
23.8%
jan 1, 1999
-19.303
+1.146
-5.6%
jan 1, 2000
-22.57
-3.267
16.93%
jan 1, 2001
-20.759
+1.811
-8.03%
jan 1, 2002
-21.698
-0.939
4.52%
jan 1, 2003
-20.718
+0.98
-4.52%
jan 1, 2004
-19.521
+1.196
-5.77%
jan 1, 2005
-21.315
-1.793
9.19%
jan 1, 2006
-20.574
+0.74
-3.47%
jan 1, 2007
-20.786
-0.212
1.03%
jan 1, 2008
-20.088
+0.698
-3.36%
jan 1, 2009
-18.765
+1.323
-6.59%
jan 1, 2010
-19.865
-1.1
5.86%
jan 1, 2011
-17.443
+2.422
-12.19%
jan 1, 2012
-17.736
-0.292
1.68%
jan 1, 2013
-17.668
+0.068
-0.38%
Ranking of countries by current statistics by years