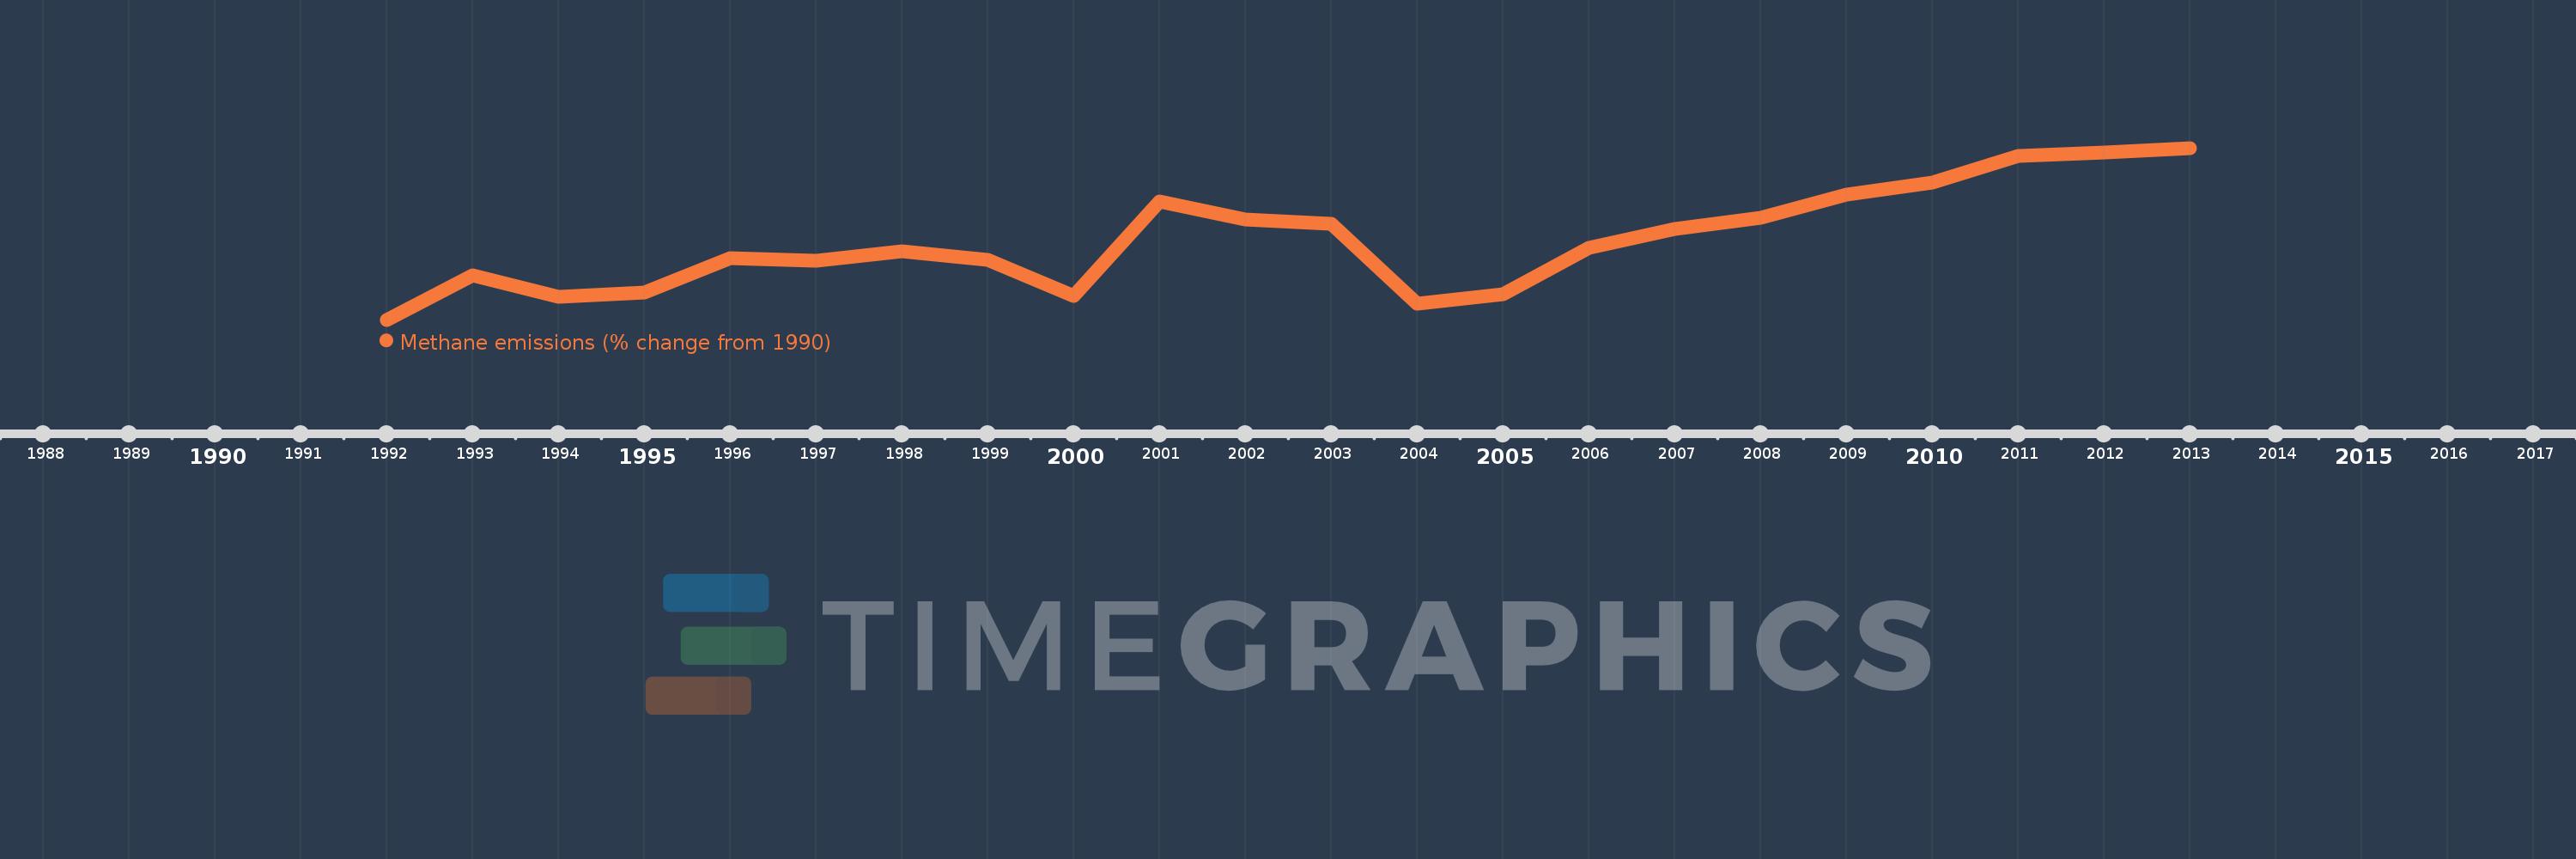
This timeline shows a graph from 1992 to 2013 of Cote d'Ivoire. No data until 1991. Number of actual observations by date: 22.
Source name:
World Development Indicators
Source organization:
World Bank staff estimates from original source: European Commission, Joint Research Centre (JRC)/Netherlands Environmental Assessment Agency (PBL). Emission Database for Global Atmospheric Research (EDGAR): http://edgar.jrc.ec.europa.eu/.
Categories, topics:
Climate Change, Environment
Last updated:
apr 23, 2017
Indicators value changes by year
Meaning:
5.061
Minimum:
-19.947
jan 1, 1992
Maximum:
33.915
jan 1, 2013
At the date of observation
Value
Absolute change
Change from the previous value
jan 1, 1992
-19.947
-19.947
0.0%
jan 1, 1993
-6.046
+13.9
-69.69%
jan 1, 1994
-12.744
-6.698
110.77%
jan 1, 1995
-11.363
+1.381
-10.83%
jan 1, 1996
-0.547
+10.816
-95.18%
jan 1, 1997
-1.457
-0.91
166.17%
jan 1, 1998
1.547
+3.004
-206.16%
jan 1, 1999
-1.159
-2.706
-174.93%
jan 1, 2000
-12.599
-11.44
986.86%
jan 1, 2001
17.213
+29.812
-236.62%
jan 1, 2002
11.567
-5.645
-32.8%
jan 1, 2003
10.09
-1.478
-12.78%
jan 1, 2004
-14.907
-24.996
-247.74%
jan 1, 2005
-11.851
+3.056
-20.5%
jan 1, 2006
2.702
+14.553
-122.8%
jan 1, 2007
8.494
+5.792
214.35%
jan 1, 2008
12.112
+3.618
42.6%
jan 1, 2009
19.284
+7.172
59.21%
jan 1, 2010
23.144
+3.86
20.01%
jan 1, 2011
31.29
+8.146
35.2%
jan 1, 2012
32.603
+1.313
4.2%
jan 1, 2013
33.915
+1.313
4.03%
Ranking of countries by current statistics by years