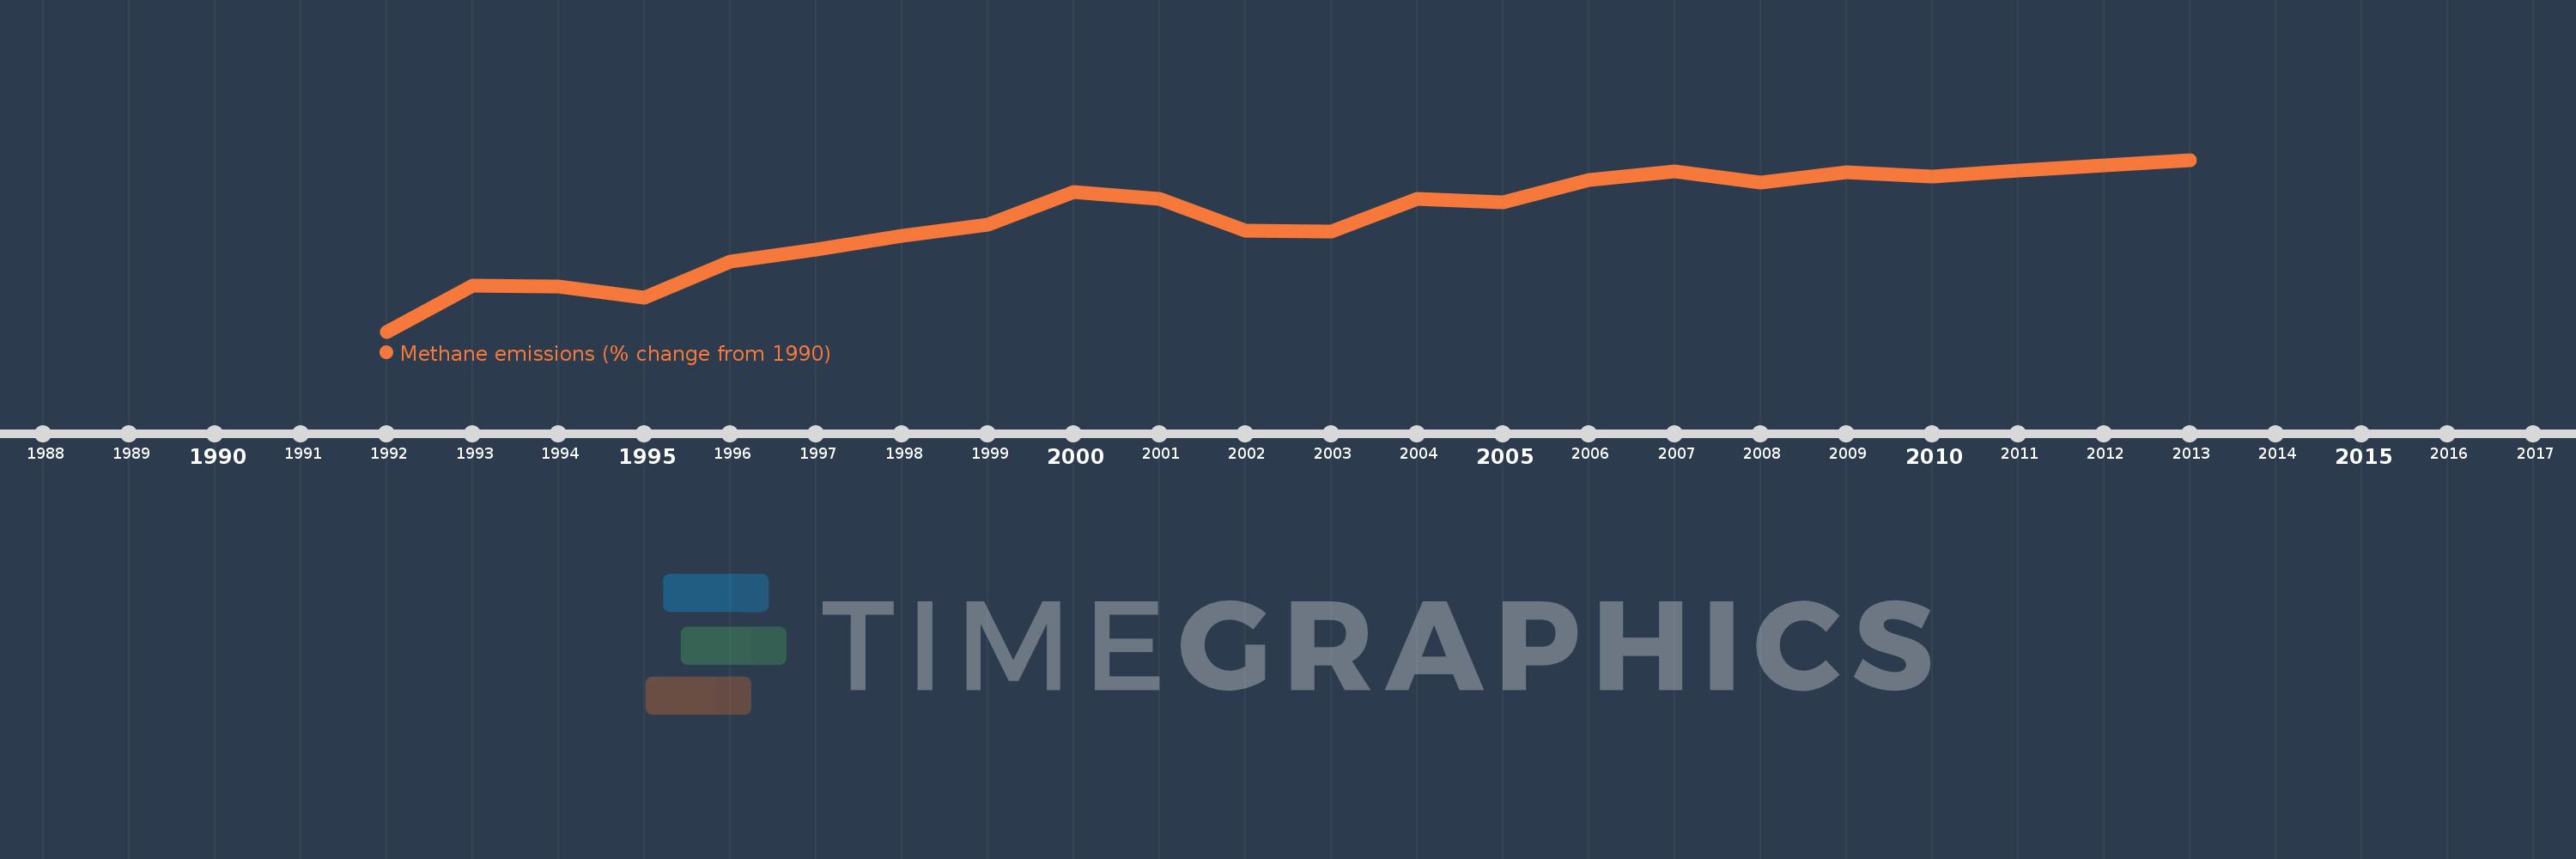
This timeline shows a graph from 1992 to 2013 of Algeria. No data until 1991. Number of actual observations by date: 22.
Source name:
World Development Indicators
Source organization:
World Bank staff estimates from original source: European Commission, Joint Research Centre (JRC)/Netherlands Environmental Assessment Agency (PBL). Emission Database for Global Atmospheric Research (EDGAR): http://edgar.jrc.ec.europa.eu/.
Categories, topics:
Climate Change, Environment
Last updated:
apr 23, 2017
Indicators value changes by year
Meaning:
34.274
Minimum:
3.422
jan 1, 1992
Maximum:
50.241
jan 1, 2013
At the date of observation
Value
Absolute change
Change from the previous value
jan 1, 1992
3.422
+3.422
0.0%
jan 1, 1993
16.062
+12.64
369.32%
jan 1, 1994
15.782
-0.28
-1.74%
jan 1, 1995
12.623
-3.16
-20.02%
jan 1, 1996
22.612
+9.989
79.14%
jan 1, 1997
25.763
+3.151
13.93%
jan 1, 1998
29.527
+3.765
14.61%
jan 1, 1999
32.558
+3.031
10.27%
jan 1, 2000
41.548
+8.989
27.61%
jan 1, 2001
39.484
-2.064
-4.97%
jan 1, 2002
30.847
-8.638
-21.88%
jan 1, 2003
30.798
-0.048
-0.16%
jan 1, 2004
39.699
+8.9
28.9%
jan 1, 2005
38.671
-1.028
-2.59%
jan 1, 2006
44.7
+6.029
15.59%
jan 1, 2007
46.985
+2.285
5.11%
jan 1, 2008
44.112
-2.873
-6.11%
jan 1, 2009
46.866
+2.754
6.24%
jan 1, 2010
45.655
-1.211
-2.58%
jan 1, 2011
47.295
+1.64
3.59%
jan 1, 2012
48.768
+1.473
3.11%
jan 1, 2013
50.241
+1.473
3.02%
Ranking of countries by current statistics by years