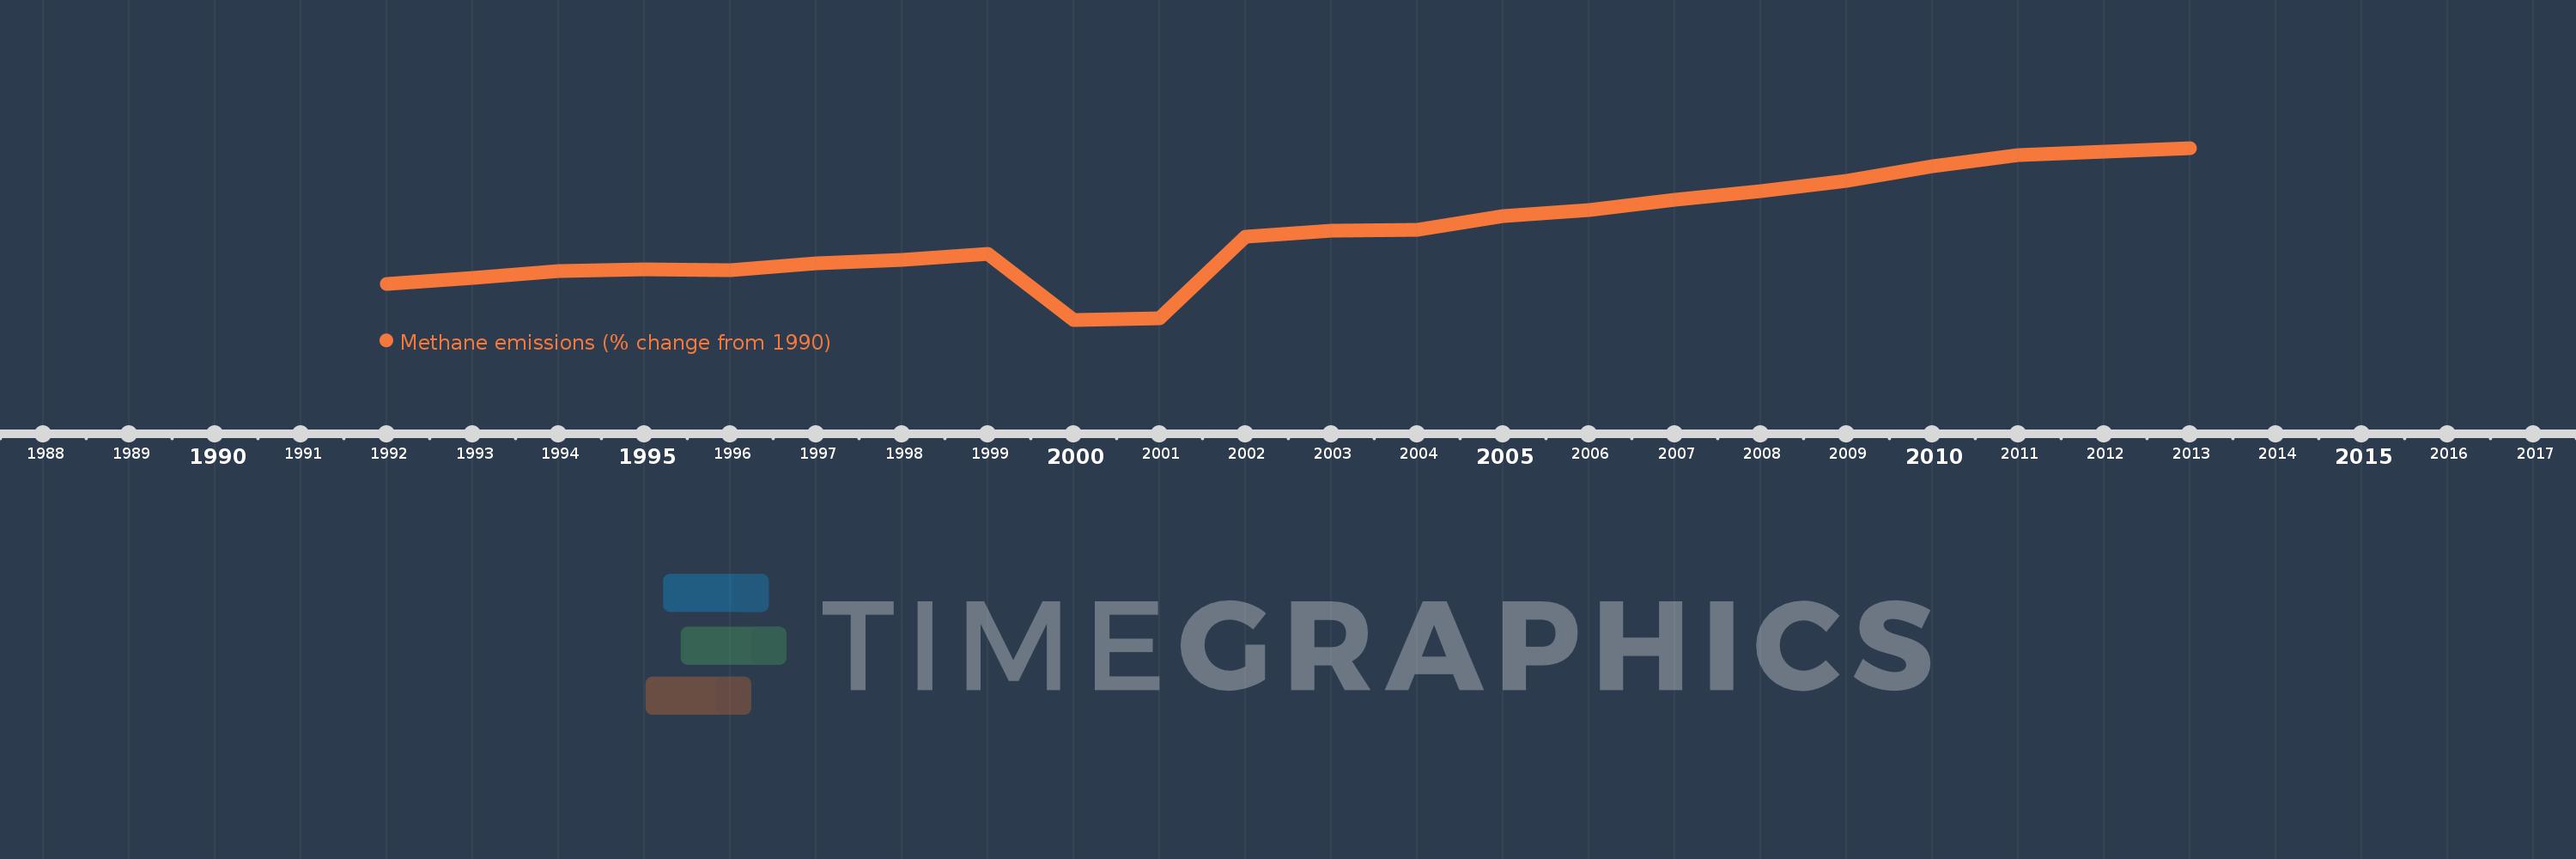
This timeline shows a graph from 1992 to 2013 of Burundi. No data until 1991. Number of actual observations by date: 22.
Source name:
World Development Indicators
Source organization:
World Bank staff estimates from original source: European Commission, Joint Research Centre (JRC)/Netherlands Environmental Assessment Agency (PBL). Emission Database for Global Atmospheric Research (EDGAR): http://edgar.jrc.ec.europa.eu/.
Categories, topics:
Climate Change, Environment
Last updated:
apr 23, 2017
Indicators value changes by year
Meaning:
23.559
Minimum:
-12.795
jan 1, 2000
Maximum:
58.402
jan 1, 2013
At the date of observation
Value
Absolute change
Change from the previous value
jan 1, 1992
1.89
+1.89
0.0%
jan 1, 1993
4.498
+2.608
138.01%
jan 1, 1994
7.434
+2.936
65.26%
jan 1, 1995
8.113
+0.679
9.14%
jan 1, 1996
7.648
-0.466
-5.74%
jan 1, 1997
10.523
+2.875
37.59%
jan 1, 1998
11.955
+1.432
13.61%
jan 1, 1999
14.672
+2.717
22.72%
jan 1, 2000
-12.795
-27.467
-187.21%
jan 1, 2001
-12.327
+0.468
-3.66%
jan 1, 2002
21.754
+34.082
-276.47%
jan 1, 2003
24.124
+2.369
10.89%
jan 1, 2004
24.313
+0.189
0.78%
jan 1, 2005
30.005
+5.692
23.41%
jan 1, 2006
32.815
+2.81
9.37%
jan 1, 2007
37.092
+4.277
13.03%
jan 1, 2008
40.618
+3.526
9.51%
jan 1, 2009
44.649
+4.031
9.92%
jan 1, 2010
50.775
+6.126
13.72%
jan 1, 2011
55.296
+4.522
8.91%
jan 1, 2012
56.849
+1.553
2.81%
jan 1, 2013
58.402
+1.553
2.73%
Ranking of countries by current statistics by years