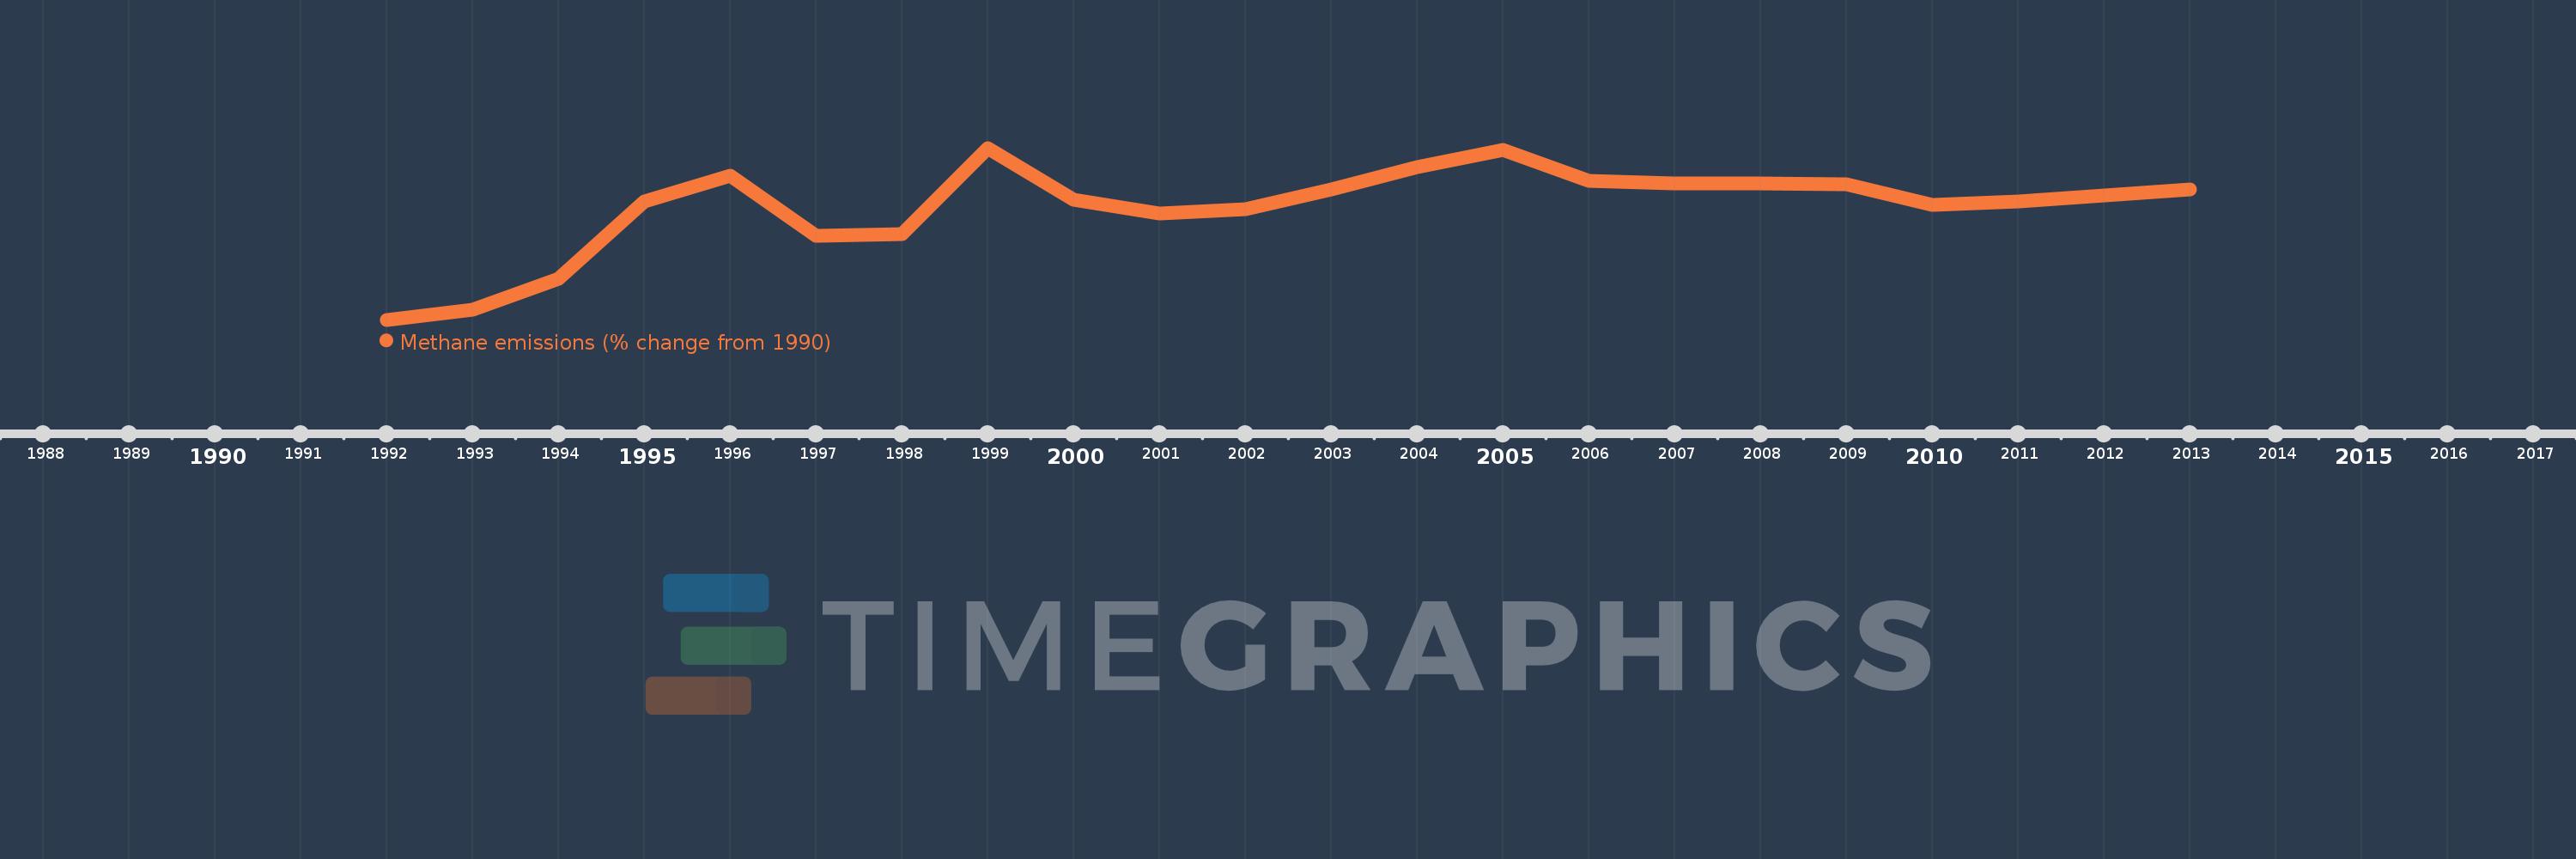
This timeline shows a graph from 1992 to 2013 of Canada. No data until 1991. Number of actual observations by date: 22.
Source name:
World Development Indicators
Source organization:
World Bank staff estimates from original source: European Commission, Joint Research Centre (JRC)/Netherlands Environmental Assessment Agency (PBL). Emission Database for Global Atmospheric Research (EDGAR): http://edgar.jrc.ec.europa.eu/.
Categories, topics:
Climate Change, Environment
Last updated:
apr 23, 2017
Indicators value changes by year
Meaning:
34.013
Minimum:
5.586
jan 1, 1992
Maximum:
48.967
jan 1, 1999
At the date of observation
Value
Absolute change
Change from the previous value
jan 1, 1992
5.586
+5.586
0.0%
jan 1, 1993
8.083
+2.497
44.7%
jan 1, 1994
15.845
+7.762
96.03%
jan 1, 1995
35.384
+19.539
123.32%
jan 1, 1996
42.065
+6.681
18.88%
jan 1, 1997
26.886
-15.179
-36.08%
jan 1, 1998
27.187
+0.301
1.12%
jan 1, 1999
48.967
+21.779
80.11%
jan 1, 2000
35.792
-13.175
-26.91%
jan 1, 2001
32.407
-3.385
-9.46%
jan 1, 2002
33.551
+1.144
3.53%
jan 1, 2003
38.432
+4.881
14.55%
jan 1, 2004
44.028
+5.596
14.56%
jan 1, 2005
48.386
+4.358
9.9%
jan 1, 2006
40.635
-7.751
-16.02%
jan 1, 2007
39.903
-0.732
-1.8%
jan 1, 2008
39.93
+0.027
0.07%
jan 1, 2009
39.768
-0.162
-0.41%
jan 1, 2010
34.557
-5.211
-13.1%
jan 1, 2011
35.464
+0.907
2.63%
jan 1, 2012
36.966
+1.502
4.23%
jan 1, 2013
38.468
+1.502
4.06%
Ranking of countries by current statistics by years